
Key Takeaways
- Google Trends shows how search interest changes over time, locations, categories, and Google search surfaces.
- Its normalized 0–100 scores indicate relative popularity, not exact monthly search volume or total market size.
- Marketers use Trends to identify seasonality, emerging queries, geographic concentration, keyword opportunities, and relevant content formats.
- Trending Now highlights unusual recent increases, while Explore supports longer-term analysis, comparisons, related searches, and broader Topics.
Google Trends is Google’s search-interest analysis tool for examining how interest in queries and topics changes across time, locations, categories, and different Google search surfaces. It can help identify whether interest in a subject is rising, falling, seasonal, geographically concentrated, or experiencing a sudden surge. Depending on the research goal, trends can be examined across Web Search, Image Search, News Search, Google Shopping, and YouTube Search.
Unlike a conventional keyword-volume tool, the standard Explore interface in Google Trends does not show exact search counts. It presents normalized relative interest on a 0–100 scale, while Trending Now can show bucketed search-volume estimates.
Google Trends normalizes search activity according to the selected location and period and presents relative interest on a 0–100 scale. A score of 100 represents the point of highest relative interest within the selected comparison, while 50 represents roughly half that relative popularity. A value of 0 can mean that there was not enough data rather than that nobody searched for the term.
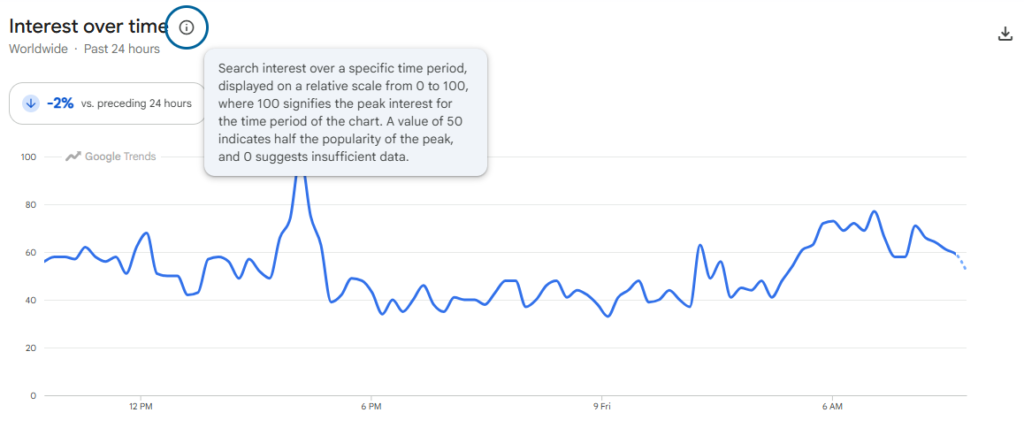
The tool can examine periods ranging from recent search activity to multi-year historical patterns, making it useful for both real-time trend discovery and long-term market research.
Main Features of Google Trends
Google Trends provides several ways to explore what people are searching for and how that interest changes.
Interest Over Time
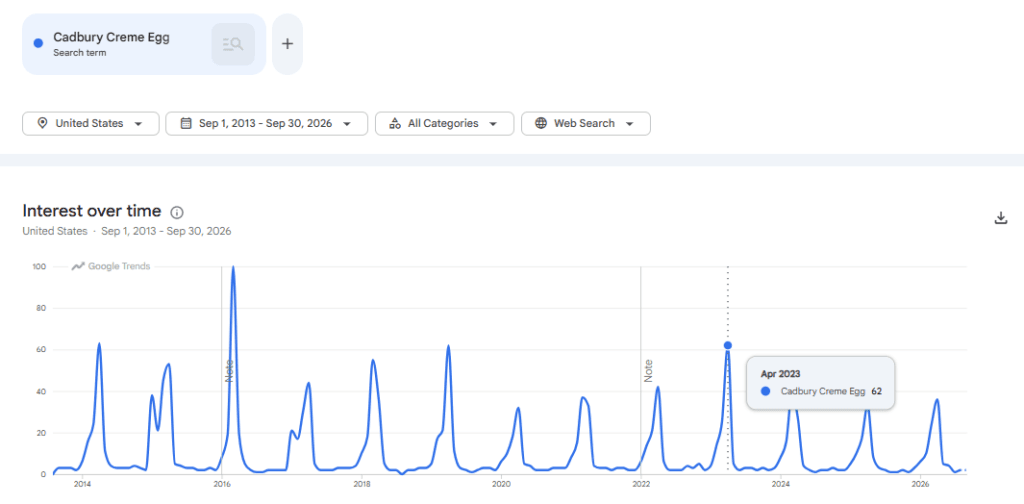
The Interest over time graph plots the relative popularity of a search against the selected date range. Each point is normalized against the total number of Google searches occurring in that location and period before being scaled from 0 to 100.
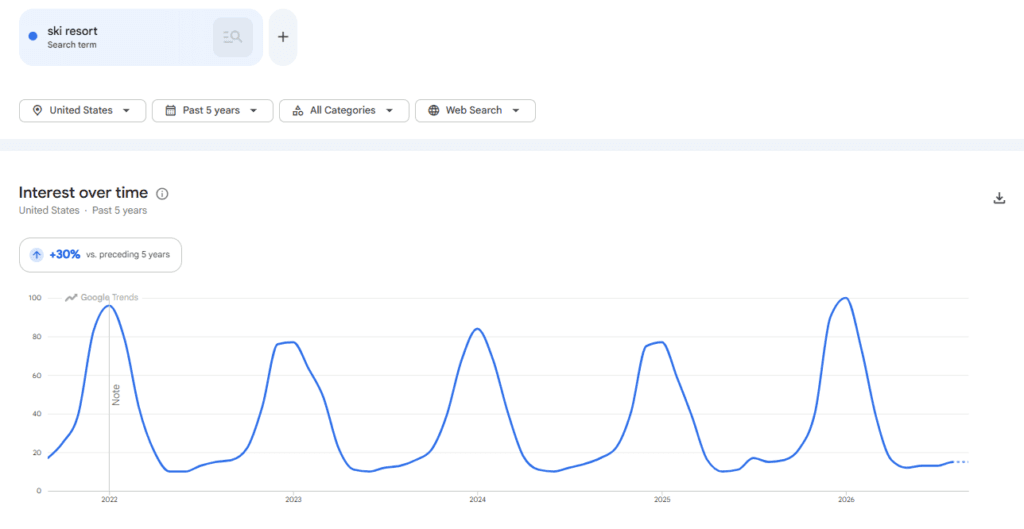
This makes it useful for comparing patterns rather than raw volume. For example, a five-year graph for sunscreen may reveal recurring seasonal peaks even though the chart does not show the exact number of monthly searches.
Search Terms and Topics
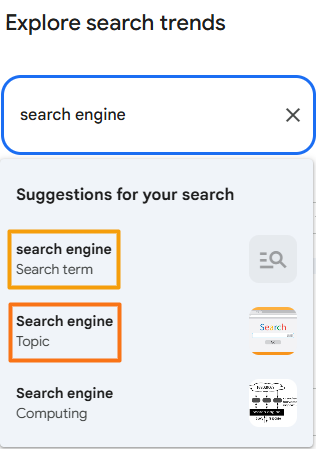
Google Trends can distinguish between a Search term and a Topic.
A Search term measures interest in the specific wording entered, while a Topic represents a broader concept or entity and can account for related searches across languages and spelling variations. Topics are particularly useful when the same concept can be searched using different terminology.
Geographic Interest
The Interest by region section shows where a search has relatively stronger interest. Results can be explored by country and narrower geographic areas such as regions, cities, and supported metropolitan areas. Geographic scores are relative to total search activity in each area rather than comparisons of raw search counts.
Search-Type Filtering
Research can be narrowed to different Google search surfaces:
- Web Search
- Image Search
- News Search
- Google Shopping
- YouTube Search
This can reveal very different behavior. A product may show modest Web Search interest but rapidly increasing interest on YouTube or Google Shopping.
Category Filtering
Categories help separate different meanings of the same or related terms.
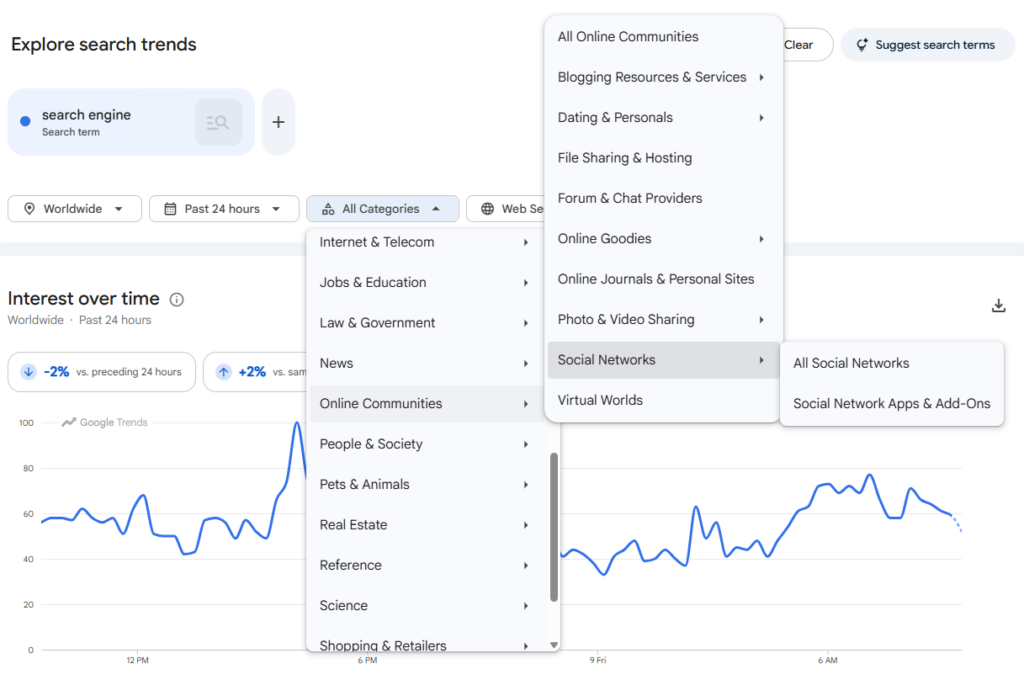
For example, marketing-related research can be narrowed through categories such as Online Communities, with more specific classifications including Social Networks, Microblogging, Blogging Resources & Services, Forums & Chat Providers, and Photo & Video Sharing. The available category structure can change as Google updates Trends.
Top and Rising Queries
Related-search information is commonly divided into two groups:
- Top queries are related searches most frequently searched with the entered term in the same search session, within the selected category and location.
- Rising queries are related searches showing the most significant growth during the selected period compared with the preceding period.
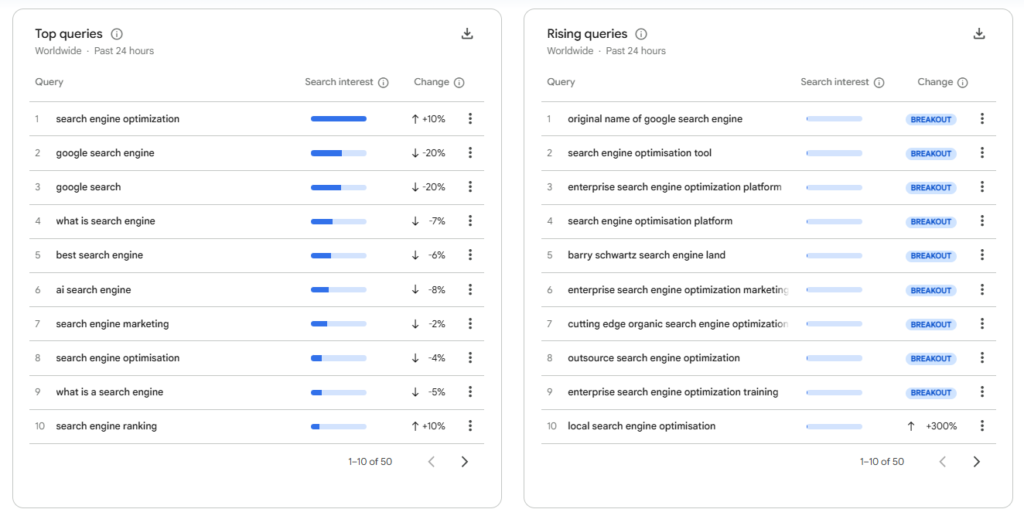
When Google displays Breakout instead of a percentage, search interest has increased by more than 5,000%. Newly emerging queries with little previous search activity frequently receive this label.
Comparing Search Interest
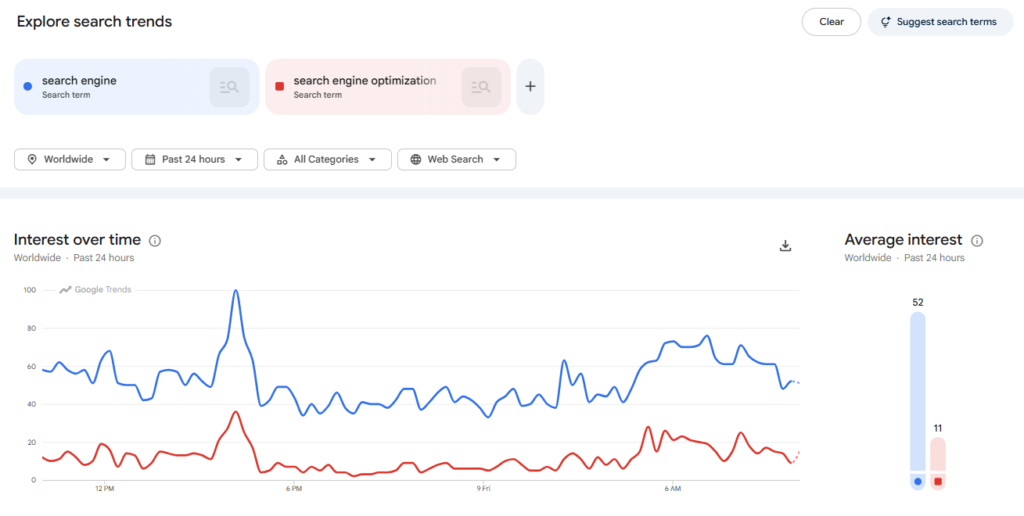
Multiple terms or topics can be plotted together to compare relative popularity across the same time and location.
Google’s current Explore experience supports up to eight groups of terms, while the classic Explore interface supports up to five groups.
How Digital Marketers Use Google Trends
Google Trends can support SEO, advertising, content, ecommerce, and broader market research when its relative data is interpreted correctly.
- SEO and Content Research: Rising searches and related queries can reveal emerging topics, alternative keyword ideas, and subjects attracting increasing interest.
- Seasonal Campaign Planning: Historical graphs can show recurring increases and decreases in demand. A retailer might discover that searches for winter coats begin rising several weeks before the coldest months and schedule content or campaigns accordingly.
- Keyword Research: Marketers can compare alternative phrases, analyze their geographic popularity, examine related searches, and determine whether a broader Topic or a specific Search Term better represents the intended audience.
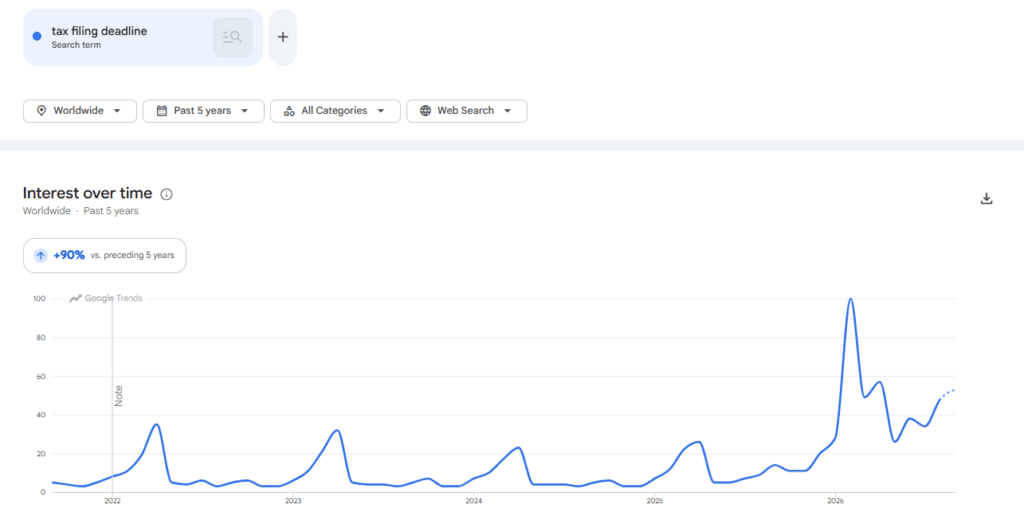
- Ecommerce Product Research: Multi-year trends can help distinguish a steadily growing product category from a short-lived spike or strongly seasonal product. Trends should not, however, be treated as proof of total market size.
- Geographic Market Research: Regional data can identify locations where relative interest in a product, service, or subject is particularly strong.
- Content Format Research: Comparing Web, YouTube, Image, News, and Shopping search behavior can indicate where interest in a topic is concentrated.
- News and Social Media Planning: Rising and breakout queries can help content teams identify developing stories, cultural moments, product trends, or industry discussions while interest is accelerating.
Google Trends data is sampled, anonymized, categorized, aggregated, and normalized, so it should be treated as an analytical signal rather than an exact record of every Google search or a scientific measurement of public opinion.
Google Trends: Trending Now
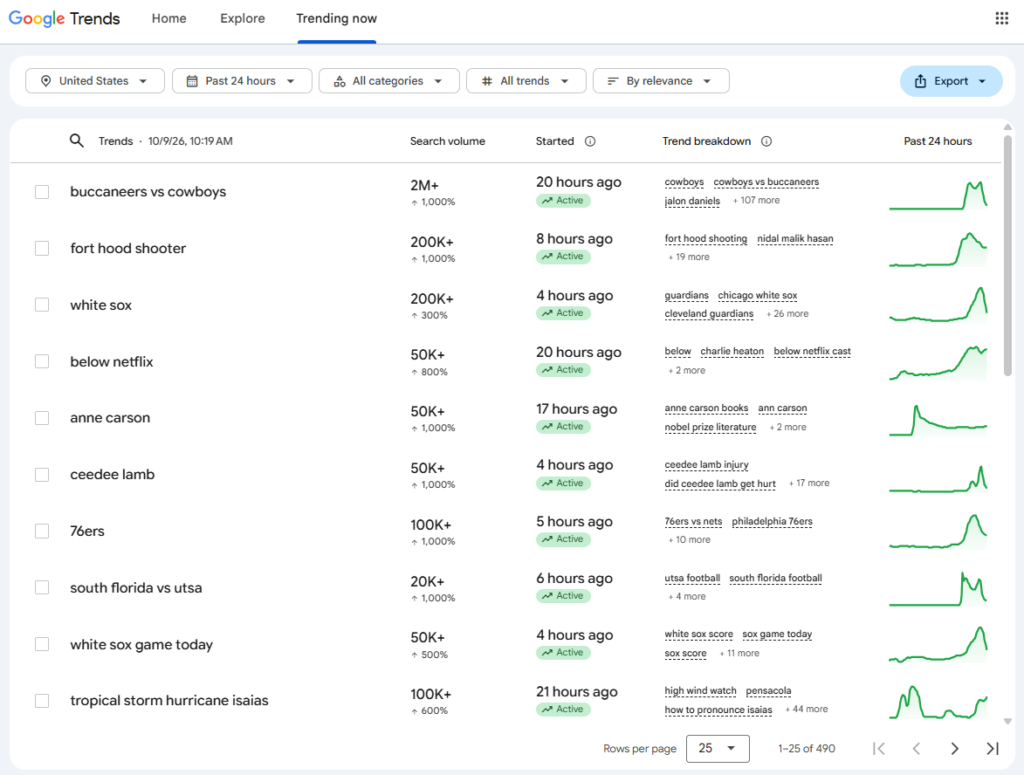
Trending Now is the real-time discovery section of Google Trends for Google Search queries experiencing a recent surge in interest. A displayed trend can represent a cluster of related or variant queries associated with a person, event, or other newsworthy story.
Google substantially upgraded Trending Now in 2024. The feature now covers more than 100 countries and regions, detects substantially more emerging trends than the previous system, and refreshes its data on average every 10 minutes.
Step 1: Select the Location
Open Trending Now and choose the country or supported region relevant to the research. Location filtering prevents unrelated global trends from overwhelming a market-specific analysis.
Step 2: Choose the Time Period
Trending Now currently allows searches that started during:
- Past 4 hours
- Past 24 hours
- Past 2 days (48 hours)
- Past 7 days
This makes the tool suitable for both very recent developments and trends that have persisted for several days.
Step 3: Filter and Sort the Trends
Results can be filtered by available categories and by whether a trend is still active.
The list can also be sorted:
- By relevance
- By title
- By recency
- By search volume
An Active trend is one that is still being searched more than usual, while an Ended trend was searched more than usual but has returned to its typical search volume.

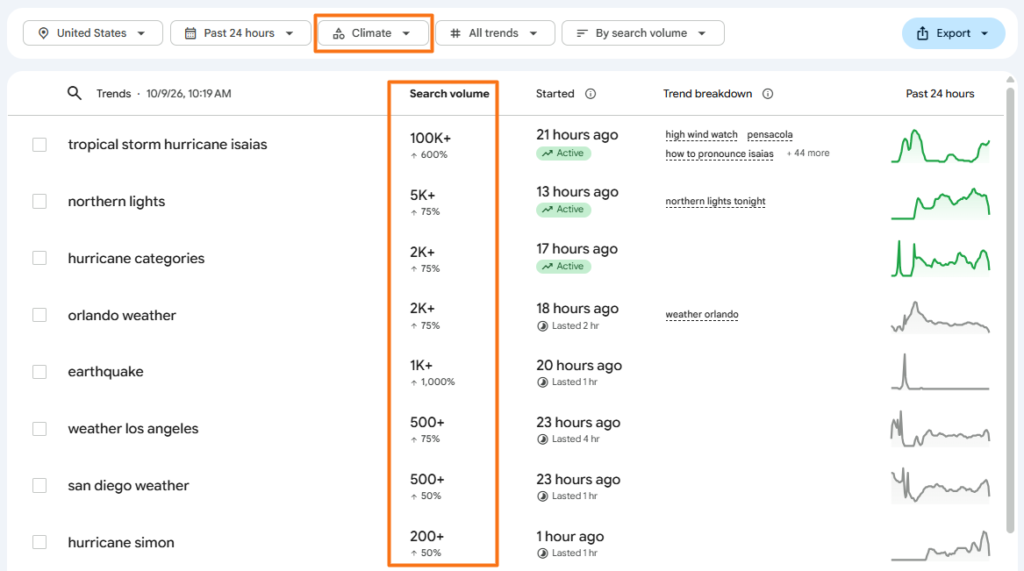
Step 4: Examine the Search Volume and Trend
Trending Now displays bucketed search-volume estimates rather than exact counts and can show percentage growth relative to Google’s predicted baseline.
This is different from the standard Explore interface, which primarily uses normalized 0–100 interest scores.
Step 5: Explore an Individual Trend
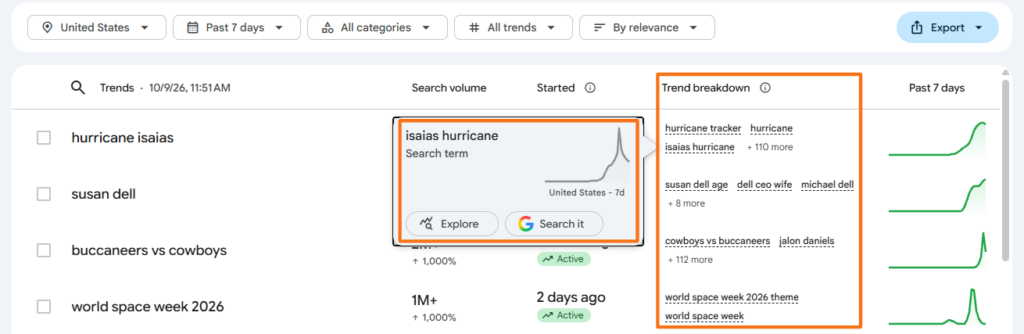
Each trend can represent a cluster of related or variant searches rather than a single query. In the Trend breakdown column, Google shows searches that contribute to that trend. Selecting one of these searches opens a panel with a short-term trend chart and options to Explore the term in Google Trends or Search it on Google. Opening a trend can also surface related news coverage under “In the news,” helping provide context for the event or story associated with the search surge.
Trending Now can be particularly useful for:
- Content marketers spotting emerging subjects.
- News publishers monitoring developing stories.
- Social media marketers identifying timely conversations.
- PPC advertisers detecting sudden changes in relevant demand.
- Ecommerce marketers tracking rapidly rising product or lifestyle interest.
Results can also be downloaded as CSV, copied to the clipboard, or followed through an RSS feed for further analysis or monitoring. (Google Help)
Frequently Asked Questions
Does Google Trends show the exact number of monthly searches?
No, the standard Google Trends Explore interface shows normalized relative search interest, usually on a 0–100 scale, rather than exact monthly search volumes. Trending Now can show bucketed search-volume estimates, but these are different from conventional monthly keyword-volume figures.
What is the difference between a Search term and a Topic?
A Search term focuses on the entered words, while a Topic represents a broader concept or entity and can capture related searches across languages and different expressions. Topics are generally more useful when the aim is to measure overall interest in a concept rather than one exact wording.
What defines a Breakout query in Google Trends?
A Breakout label means the query’s search interest increased by more than 5,000% compared with the previous period. It often appears for newly emerging searches that previously had little search activity.
What does a score of 100 mean on a Google Trends chart?
A score of 100 represents the highest relative search interest within the selected location, time period, and comparison. It does not mean that exactly 100 searches occurred or that the query has reached its highest search volume of all time.