
Key Takeaways
- Chrome DevTools is built into Chrome, enabling real-time inspection, debugging, testing, and optimization of webpages.
- Its panels can help inspect and test rendered HTML, CSS, JavaScript, network activity, storage, performance data, security details, and more.
- The Performance panel and Lighthouse serve different purposes: Performance supports detailed local tracing and Core Web Vitals investigation, while Lighthouse runs automated lab audits and produces category scores.
- SEO and marketing professionals can use DevTools to investigate Core Web Vitals, responsiveness, metadata, structured data, tracking requests, and page resources.
Chrome DevTools is Chrome’s built-in toolkit for inspecting, debugging, testing, and optimizing webpages directly in the browser. It allows developers, SEO professionals, designers, and website owners to examine how webpages behave in real time.
DevTools provides access to the webpage’s rendered HTML, CSS, JavaScript, network activity, browser storage, performance information, and other technical details. It can also be used to temporarily change text, styles, and page elements without modifying the original files stored on the website’s server. Google describes DevTools as a built-in toolset for editing pages and diagnosing website problems.
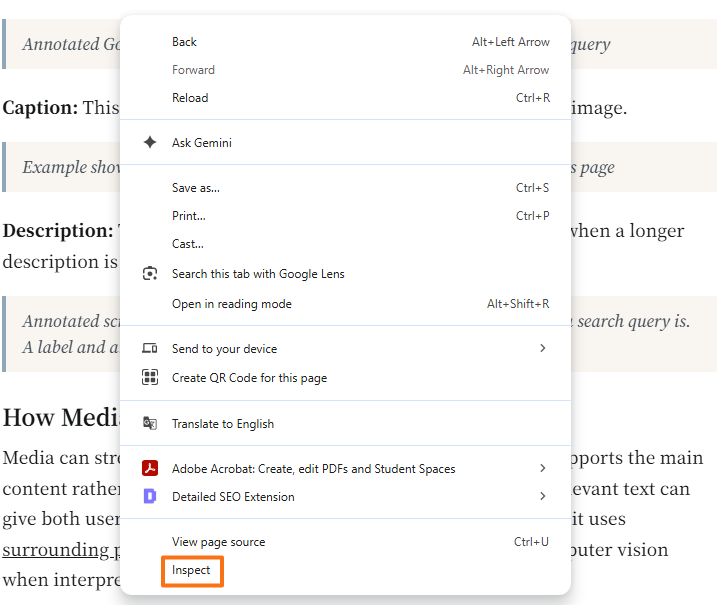
Chrome DevTools can be opened through the browser menu, by right-clicking a webpage and selecting Inspect, or with keyboard shortcuts.
Cmd + Option + I
Cmd + Option + C
Chrome launched in 2008, and its developer tools have evolved alongside the browser. Early Chrome incorporated WebKit’s Web Inspector, and much of that tool’s functionality survives today in the Elements panel.
Most changes made directly through DevTools are temporary and disappear after the page is reloaded. More advanced features such as Local Overrides and Workspaces can deliberately persist selected development changes.
Who Maintains Chrome DevTools?
Chrome DevTools is developed for Google Chrome within the wider Chromium ecosystem, and the DevTools frontend source code is publicly available. Chromium-based browsers can reuse and customize related developer tooling.
Microsoft Edge, for example, provides its own Chromium-based developer tools with many of the same core panels and workflows, including Elements, Sources, Console, Network, Performance, Memory, and Application.
Who Uses Chrome DevTools?
Chrome DevTools is primarily designed for web development, but several other professionals use it to understand how webpages behave inside a browser.
Frontend Developers
Frontend developers use DevTools to inspect and temporarily edit HTML and CSS, debug JavaScript, set breakpoints, examine network requests, and troubleshoot browser-side problems.
SEO and Performance Specialists
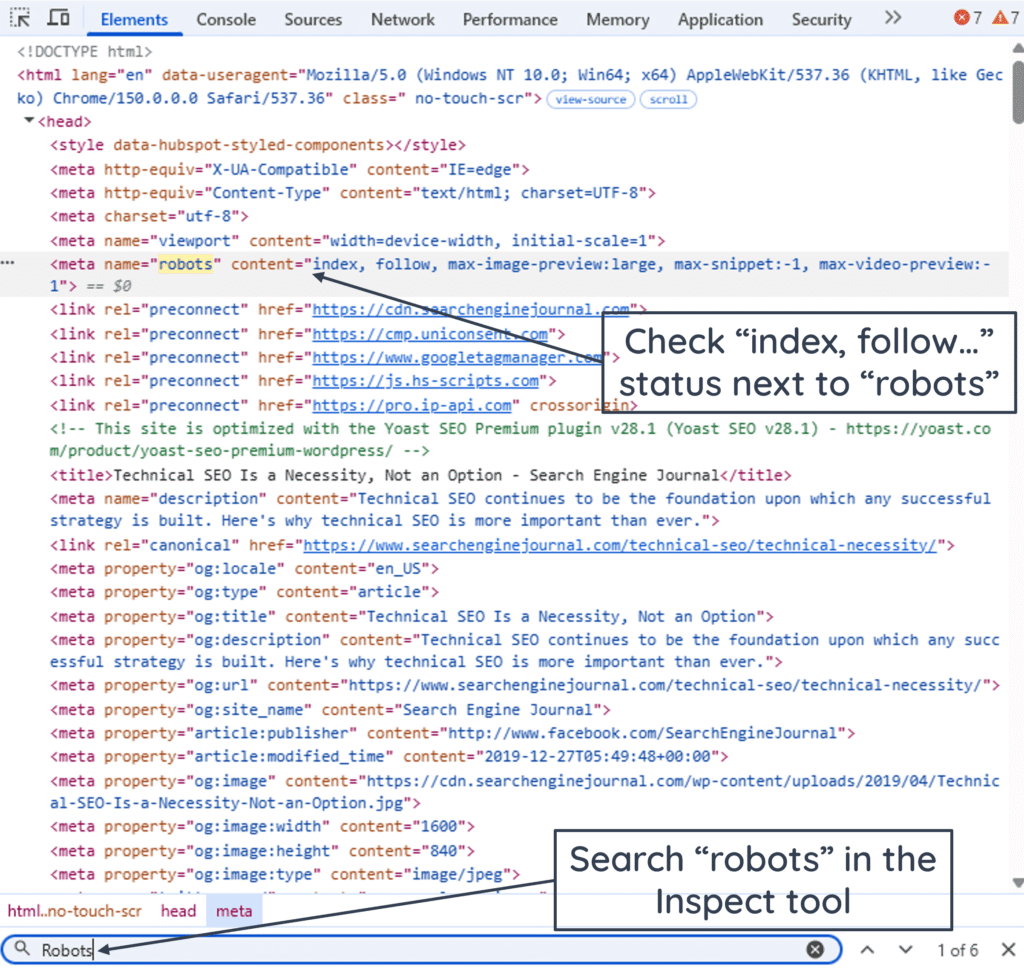
SEO and performance specialists use DevTools to inspect rendered HTML, examine links and metadata, verify structured-data placement, check status codes and network resources, analyze Core Web Vitals, and investigate page-performance problems.
UI/UX Designers
Designers can test spacing, typography, colors, dimensions, layouts, and responsive behavior directly on a webpage before permanent design changes are implemented.
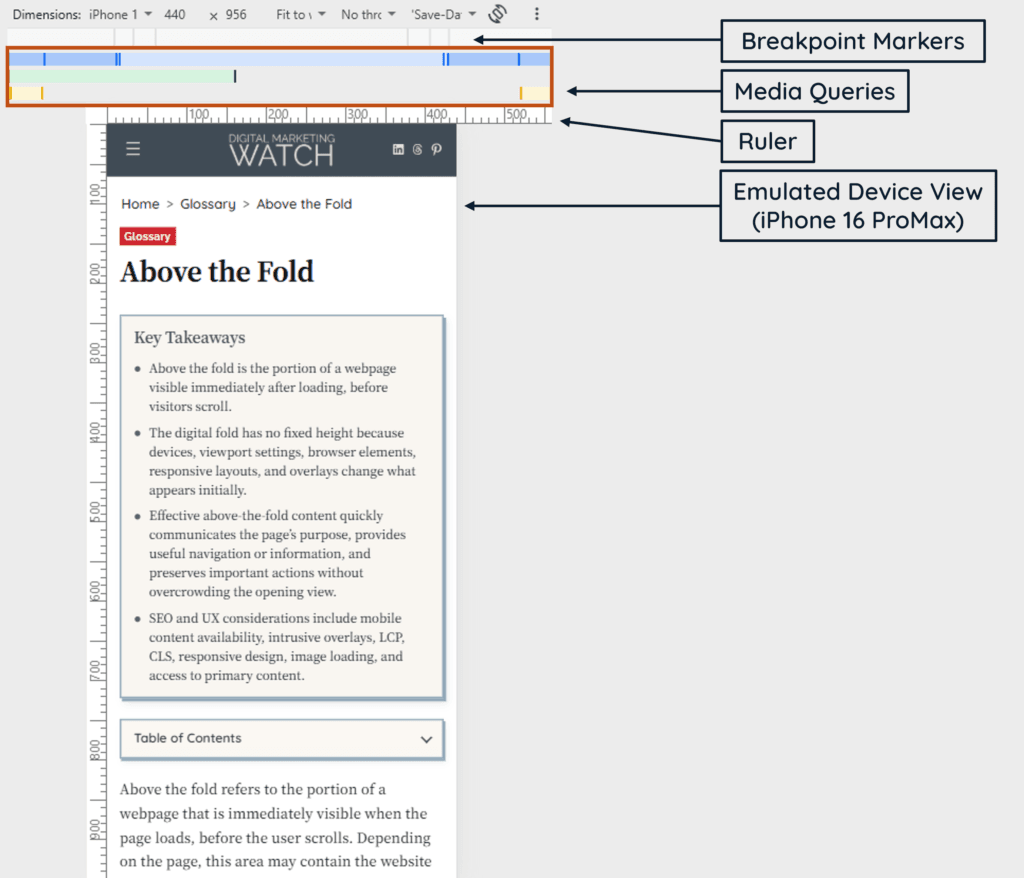
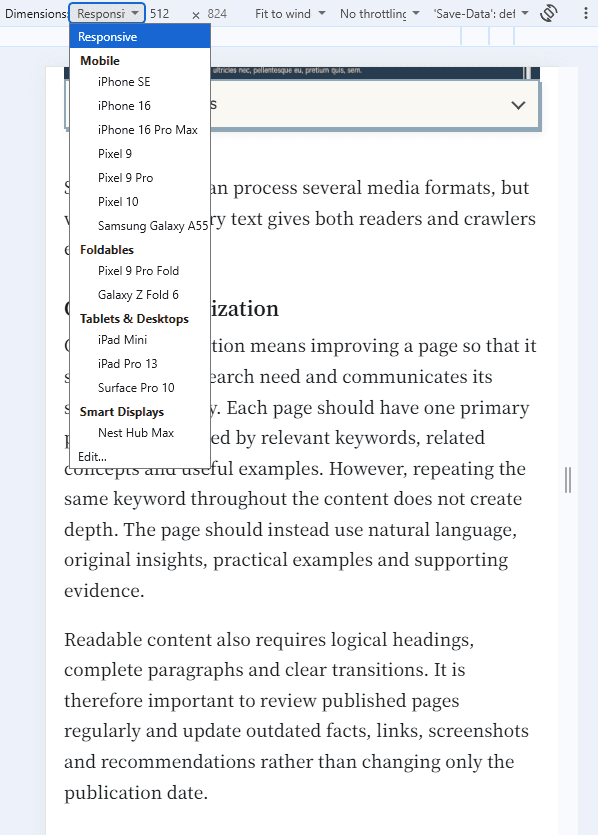
DevTools also includes Device Mode, which can emulate different viewport sizes, network conditions, and CPU performance. Google describes this as an approximation of mobile use rather than a substitute for testing on a physical device.
Main Panels in Chrome DevTools
DevTools is organized into panels, each designed for a different type of inspection or debugging task.
- Elements: Displays the webpage’s live DOM and CSS. HTML, text, styles, spacing, fonts, and other visual properties can be inspected and temporarily modified.
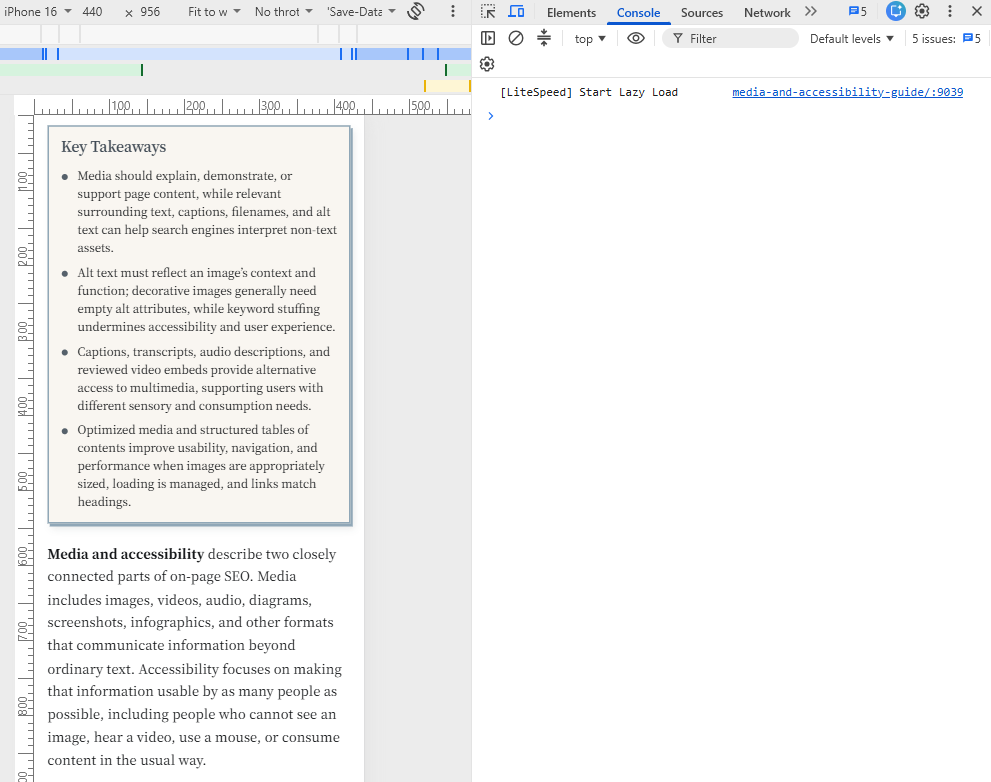
- Console: Displays JavaScript messages and errors and provides a command-line environment for running JavaScript against the current page.
- Sources: Shows loaded source files and provides tools for debugging JavaScript, setting breakpoints, running snippets, and creating local overrides.
- Network: Records requests made while the page loads or operates. It shows resources such as images, stylesheets, scripts, fonts, and API requests along with status codes, sizes, headers, and timing information.
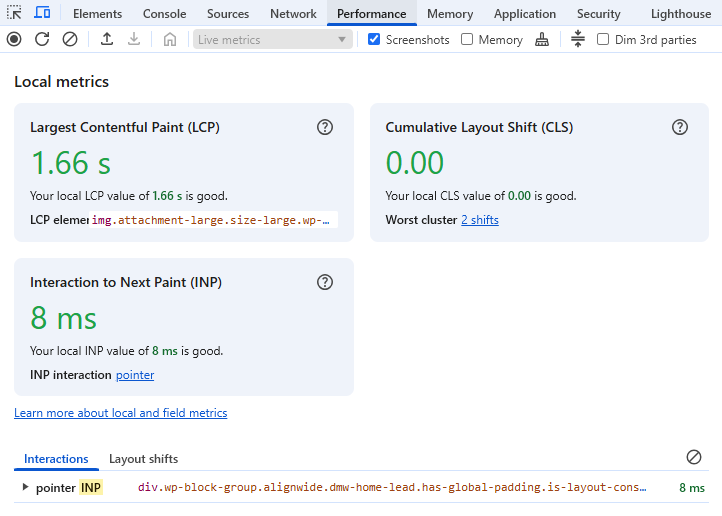
- Performance: Records loading and runtime activity to identify performance bottlenecks. The panel can display local LCP, CLS, and INP measurements and can optionally compare them with Chrome UX Report field data.
- Application: Inspects browser-side resources including cookies, Local Storage, IndexedDB, Session Storage, Cache Storage, service workers, and web-app information.
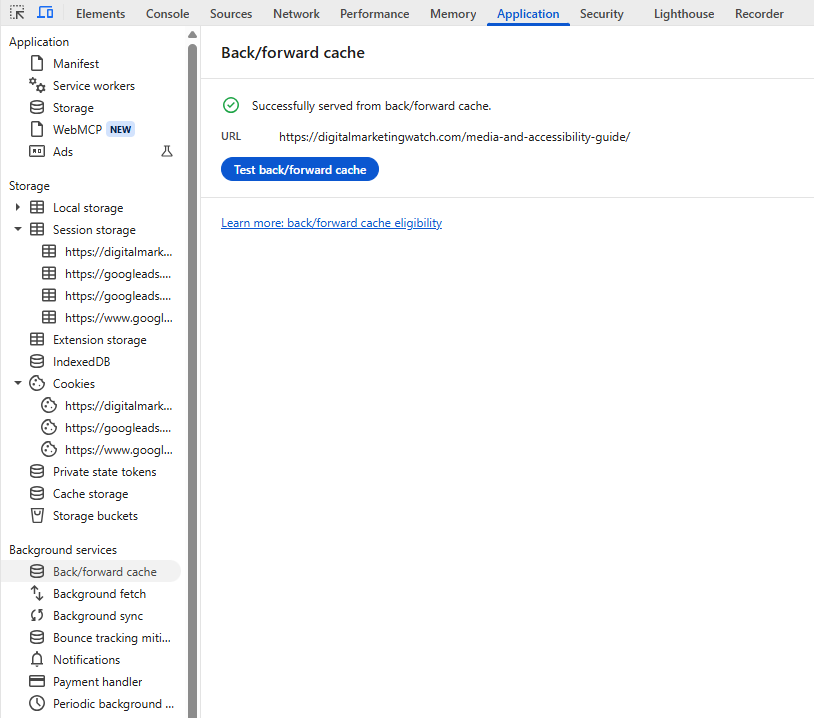
- Memory: Provides tools for investigating JavaScript memory usage and problems such as memory leaks.
- Security: Helps inspect HTTPS protection, certificates, insecure origins, mixed content, and related security information.
- Lighthouse: Runs automated audits for categories such as Performance, Accessibility, Best Practices, and SEO. Google recommends the Performance panel when deeper performance debugging is required.
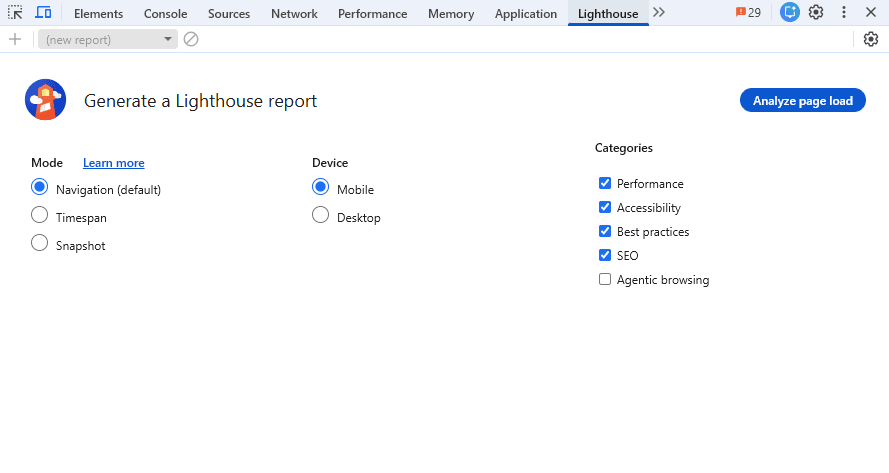
Other useful tools in DevTools include Coverage for identifying unused CSS and JavaScript, Animations for inspecting animations, Network Conditions for changing network or user-agent settings, Sensors for emulating conditions such as geolocation, and Recorder for recording and replaying user flows.
Inspecting and Optimizing a Page With DevTools
Chrome DevTools can be used to inspect how a page is rendered, measure performance, test responsiveness, review network activity, and troubleshoot technical issues without changing the live page.
For more reliable performance and troubleshooting checks, some tests should also be repeated in Chrome Incognito mode, where extensions and stored browsing data are less likely to interfere with results. This helps distinguish genuine page behavior from effects caused by extensions, cached resources, cookies, or an existing browser session.
A beginner can combine several panels in a simple diagnostic workflow:
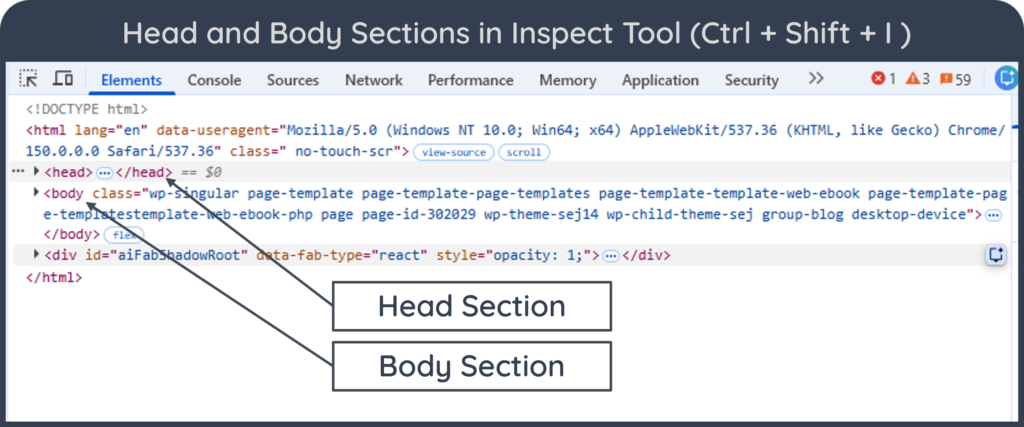
- Inspect the Page Structure: Right-click an element and select Inspect to examine its HTML and CSS.
- Test Responsive Layouts: Open Device Mode to check different viewport dimensions and orientations.
- Review Network Activity: Open Network and reload the page to identify failed requests, large resources, response codes, or slow transfers.
- Analyze Performance: Use Performance to examine Core Web Vitals and record a performance trace when deeper investigation is needed.
- Run a Lighthouse Audit: Use Lighthouse for an automated review of Performance, Best Practices, Accessibility, and SEO.
- Inspect Storage and Security: Check Application and Security when investigating cookies, storage, service workers, certificates, or mixed content.
How Marketers and SEO Professionals Can Use Chrome DevTools
DevTools can support several practical marketing and SEO checks:
- Audit Core Web Vitals: Investigate loading, responsiveness, and layout stability.
- Test Mobile Responsiveness: Preview pages across different viewport sizes and conditions.
- Inspect Schema and Metadata: Check structured data and important page metadata.
- Investigate Website Technology: Examine publicly loaded scripts, requests, and browser resources.
- Verify Tracking Requests: Check whether expected analytics and advertising requests are being sent.
- Preview Copy and Design Changes: Test headlines, CTAs, layouts, fonts, and spacing.
- Test Location and User-Agent Behavior: Simulate selected browser and location conditions.
The table below shows which DevTools panels are most useful for common marketing and SEO tasks and what to check in each one. It can serve as a quick reference when diagnosing performance, responsiveness, tracking, metadata, or other page-level issues.
DevTools can reveal publicly exposed clues about a website’s technology, but it cannot reliably identify every CMS plugin, server-side service, or other technology in use. Similarly, seeing an analytics request in Network can help verify that a request was sent, but it does not prove that the complete tracking and attribution configuration is correct.
Frequently Asked Questions
Is Chrome DevTools completely free to use?
Yes, Chrome DevTools is built into Google Chrome and does not require a separate subscription or paid account.
Why do website modifications disappear when the page is reloaded?
Most changes made through the Elements panel modify only the version of the webpage currently displayed in the browser. Reloading the page normally restores the content and styles delivered by the website, although features such as Local Overrides can be used to preserve selected development changes.
Can DevTools show how a website looks on an iPhone or Android device?
Yes, Device Mode can approximate different mobile viewport dimensions and operating conditions. However, real-device testing is preferable when accuracy is important because desktop emulation cannot reproduce every characteristic of physical mobile hardware.
How can DevTools help identify why a webpage is loading slowly?
Start with the Performance panel to inspect Core Web Vitals, performance traces, and potential bottlenecks. The Network panel can then help identify individual resources that are particularly large, slow, blocked, or failing.
Do Chromium-based browsers such as Microsoft Edge or Brave have similar developer tools?
Chromium-based browsers generally provide closely related developer tools, although individual browsers can customize their interfaces and features. Microsoft Edge, for example, provides its own Edge DevTools rather than literally running the Chrome-branded interface.
What can be done if the DevTools panel gets stuck or appears broken?
Close and reopen DevTools, reload the webpage, or restart Chrome if necessary. Browser extensions or experimental DevTools settings can occasionally interfere with testing, so reproducing the problem in a clean browser session can also help.
Can Chrome DevTools inspect paywalled content?
DevTools can inspect HTML, scripts, requests, and other resources that the browser has legitimately received. It does not provide authorized access to content withheld by a server-side paywall or subscription system and should not be treated as a way to bypass access controls.