Key Takeaways
- Click-Through Rate (CTR) measures the percentage of impressions that result in clicks, calculated as clicks divided by impressions, multiplied by 100.
- Organic CTR shows how effectively search visibility becomes website visits, while paid-search and social-media CTR depend on platform-specific impression and click definitions.
- CTR is influenced by ranking position, search intent, titles, snippets, SERP features, device type, brand familiarity, targeting, placement, and creative quality.
- There is no universal good CTR; performance should be compared by channel, industry, query, device, position, campaign objective, and search-result layout.
Click-Through Rate (CTR) is the percentage of impressions that result in a click on a link, advertisement, or other clickable result. In SEO, organic CTR shows how often people click a website’s search result compared with how often that result receives an impression in Google Search.
CTR helps measure whether search visibility is turning into website visits. A page can receive thousands of impressions because it appears frequently in search results, but a low CTR means only a small proportion of those appearances lead to clicks. Ranking position, search intent, the title link and snippet, SERP features, device type, and brand familiarity can all influence the result.
Google Search Console (GSC) reports CTR alongside clicks, impressions, and average position.
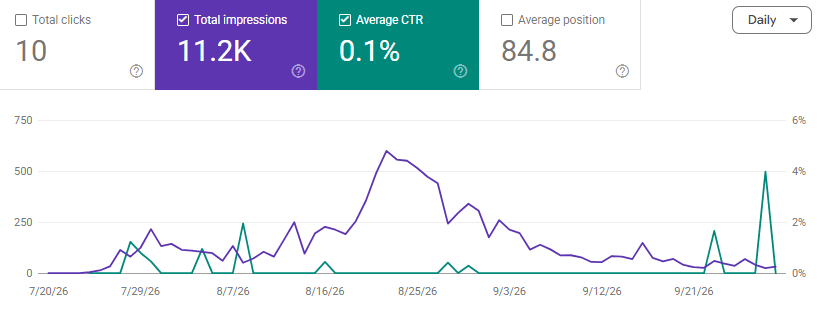
Google defines the metric as clicks divided by impressions.
For example, if a LinkedIn post records 10,000 impressions and receives 100 clicks, the CTR is 1%.
CTR vs. Conversion Rate
CTR measures how often impressions produce clicks, while conversion rate measures how often visits or interactions produce a desired action. A high CTR can bring more traffic without necessarily producing more leads or sales.
CTR in Organic Search, Paid Search, and Social Media
CTR is used across several digital marketing channels, although what counts as an impression or click can vary between platforms.
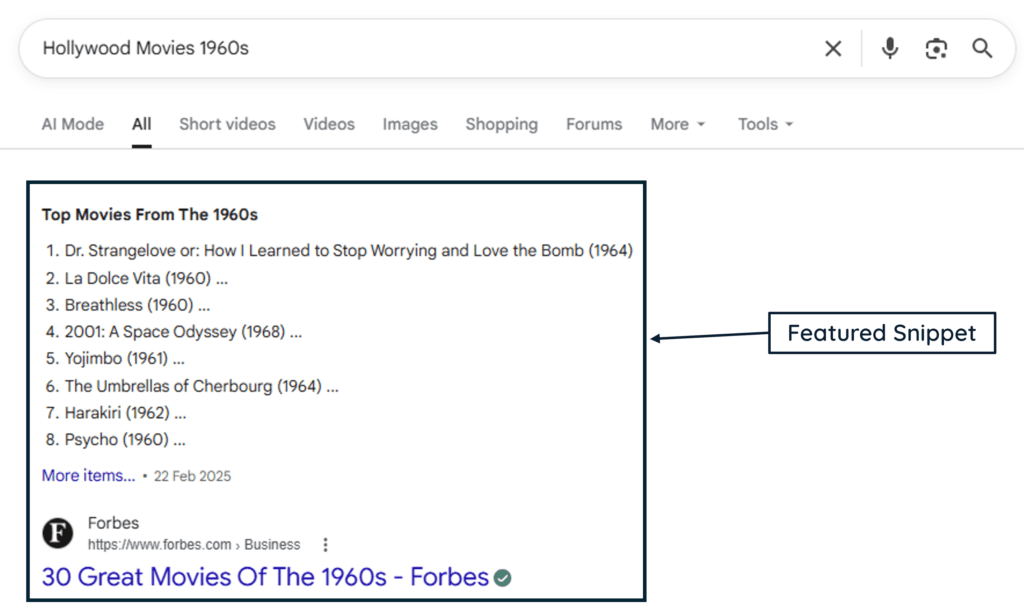
- Organic Search: Organic CTR measures how frequently a search result receives clicks compared with its impressions. Ranking position has a major influence, but query intent, device, brand recognition, and SERP features such as AI Overviews, local results, images, and featured snippets can also affect CTR.
- Paid Search: Paid-search CTR measures how often an advertisement is clicked after being displayed. Ad relevance, targeting, placement, competition, and the searcher’s intent can all influence the result. Google Ads also uses expected CTR as one component of Ad Rank.
- Social Media: Social-media CTR measures how often displayed posts or advertisements generate the particular clicks being measured. Creative quality, audience targeting, placement, platform, campaign objective, and format can all affect performance.
Search and social media also begin from different user situations. Search CTR is strongly influenced by existing search intent, while social-media content often has to attract attention while a person is browsing a feed.
Average Click-Through Rates and Industry Benchmarks
There is no universal good or bad CTR. Appropriate benchmarks depend on factors such as ranking position, industry, channel, query type, device, campaign objective, and the layout of the search results.
Organic CTR by Ranking Position
Advanced Web Ranking’s July 2026 organic CTR study reports the following average click-through rates by Google ranking position for U.S. desktop searches. These figures are third-party benchmarks rather than official Google CTR figures, and actual CTR can vary substantially depending on device, query intent, industry, branded searches, and SERP features such as AI Overviews.
The broader lesson is more important than any individual percentage: top organic positions generally attract substantially more clicks than lower positions, although CTR does not decline perfectly at every position in every dataset. Actual performance can differ considerably when AI Overviews, local packs, featured snippets, images, advertisements, and other SERP features change the available screen space.
Organic CTR by Industry
Organic CTR can also vary considerably by industry. Advanced Web Ranking’s July 2026 U.S. Google data shows that the average CTR for the first organic position ranged from more than 30% in some categories to below 20% in others. The figures below are third-party benchmarks for Position 1 across all devices and should not be treated as universal CTR targets.
Change in Position 1 CTR by SERP Features
SERP layout can materially affect CTR alongside ranking position. In the same July 2026 dataset, Advanced Web Ranking compared the CTR of Position 1 across different SERP-feature combinations with the overall 20.02% Position 1 average. Some layouts were associated with substantially higher CTR, while AI Overviews and local packs were often associated with lower CTR for the first organic result.
Average Paid Search CTR by Industry
CTR also varies significantly across industries in paid search. WordStream’s 2026 search advertising benchmarks show substantial differences in average CTR between industries.
WordStream’s reported overall CTR benchmark was 6.64%, while individual industry figures ranged from about 5.5% to more than 12%. This explains why paid-search CTR should be compared with relevant sector benchmarks rather than a single universal target.
Social Media CTR Benchmarks
Social-media benchmarks are even harder to combine because different platforms, objectives, placements, and click definitions produce different results.
For example, WordStream’s 2026 Facebook advertising benchmarks reported a 1.93% CTR for traffic campaigns and 2.70% for lead campaigns across the industries studied. These figures are useful Facebook benchmarks but should not be treated as averages for LinkedIn, Instagram, X, or all social-media activity.
Why CTR Is an Important SEO Indicator
CTR helps show how effectively existing search visibility is turning into website traffic.
- Measures Search-to-Visit Performance: Impressions show that a result is appearing in Search, while CTR shows how frequently those appearances lead to clicks. Examining both metrics together provides a clearer picture of organic search performance.
- Finds Traffic Opportunities Without More Impressions: Improving CTR can generate additional visits from the same amount of search visibility. If a page receives 10,000 impressions, increasing CTR from 2% to 4% increases clicks from 200 to 400 without increasing impressions.
- Highlights Title and Snippet Opportunities: A high-impression query with a relatively low CTR can justify reviewing the visible title link and search snippet. However, low CTR does not automatically mean either is poor because ranking position and SERP features may be responsible.
- Reveals Search-Intent Misalignment: A page can be relevant enough to appear for a query without being the result searchers most want to visit. Comparing queries, impressions, positions, and CTR can reveal where the page’s presentation or content may not align closely enough with intent.
- Shows the Effect of Search Appearance: Favicons, site names, rich results, images, and other search features can change how a listing appears. CTR trends can help evaluate whether changes to search appearance are associated with more clicks.
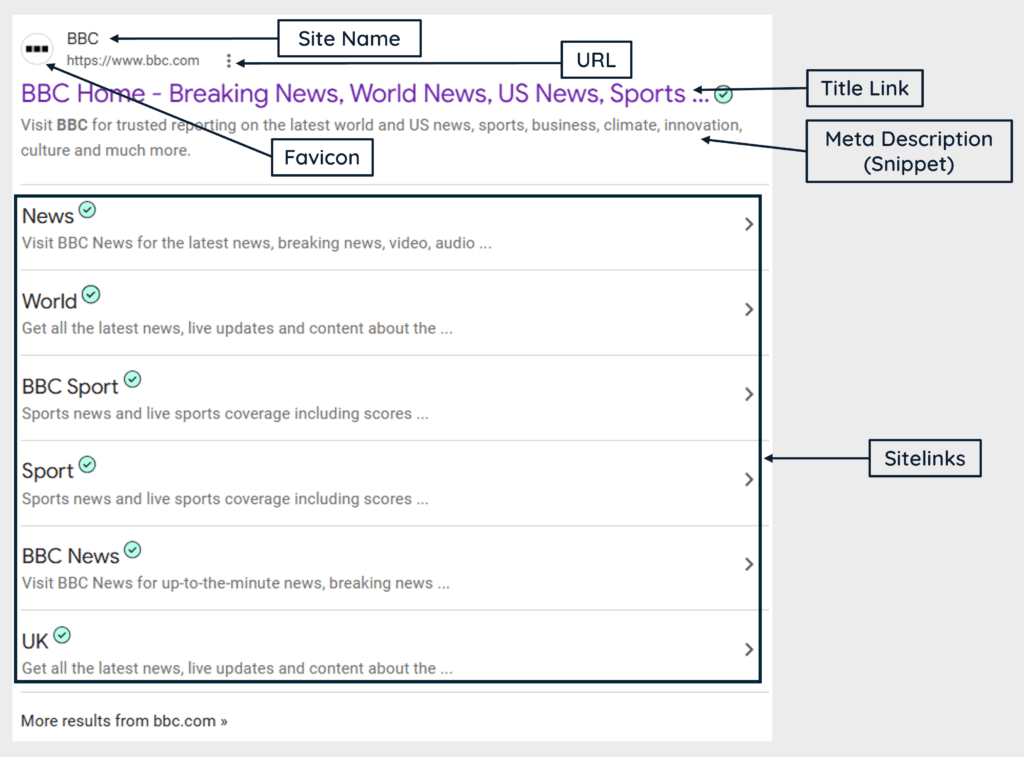
- Supports Paid Advertising Decisions: Advertisers use CTR to evaluate how effectively ads generate interaction after being displayed. In Google Ads, CTR can help assess the relevance and effectiveness of advertisements, listings, and keywords.
How to Improve a Page’s Organic CTR
CTR optimization should focus on making the search result accurate, relevant, recognizable, and useful to the searcher, rather than simply making it more attention-grabbing.
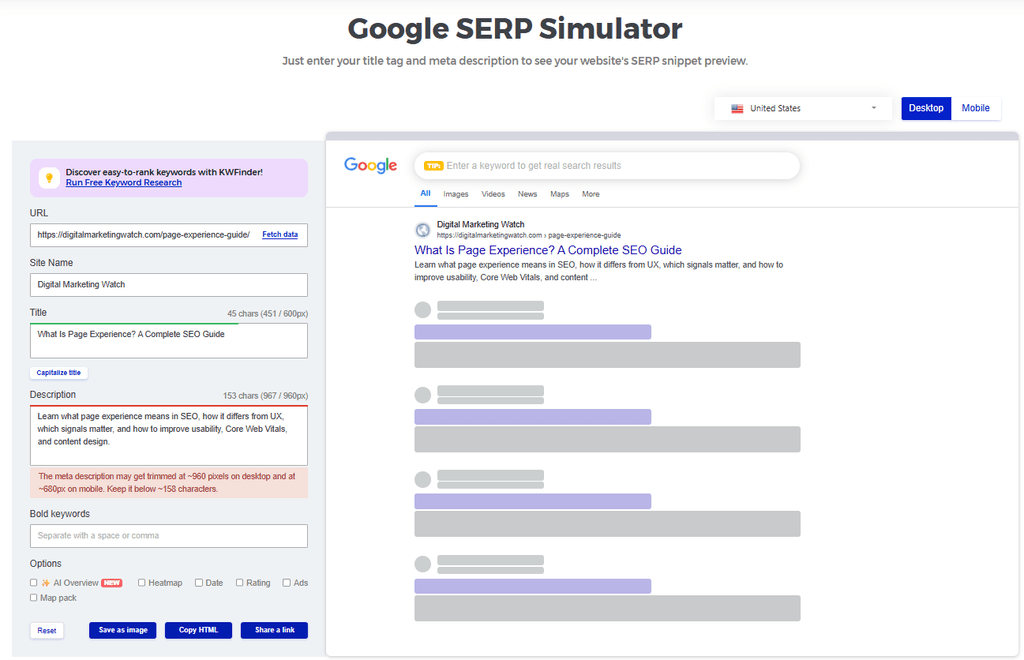
- Write a clear, descriptive title that communicates the page’s subject and closely matches the intended search query.
- Create useful meta descriptions that summarize the page and provide a reason to visit it, while remembering that Google may generate a different snippet.
- Add appropriate Schema.org structured data where the page qualifies for supported rich-result features. Structured data provides eligibility rather than guaranteeing a particular appearance.
- Answer the main search intent clearly so the title, visible snippet, and actual page content promise the same information.

- Provide a consistent preferred site name and a valid favicon so Google can use them when appropriate in search results.
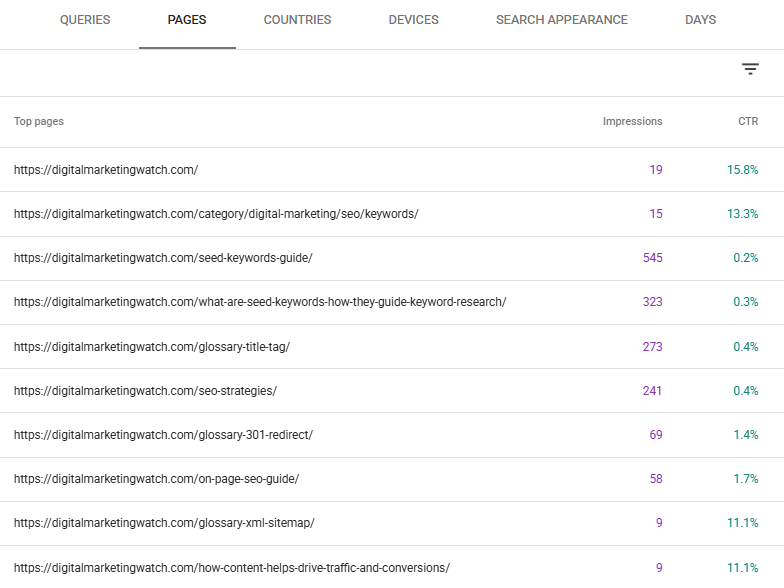
- Compare CTR by query, page, device, position, and search appearance instead of judging performance only from the site’s overall average.
- Preview titles and descriptions with a SERP simulator, such as Mangools SERP Simulator, while remembering that Google’s actual title link and snippet may differ.
Changes should be tested over a meaningful period. A higher CTR after an update can be useful evidence, but ranking changes, search demand, device mix, and SERP changes should also be considered before attributing the improvement to one edit.
How to Track CTR in Google Search Console
Google Search Console provides first-party organic CTR data for verified websites.
Open: Google Search Console → Performance → Search results. Then:
- Select Total Clicks, Total Impressions, and Average CTR above the performance graph.
- Open Queries to identify searches generating impressions and clicks.
- Open Pages to compare CTR between individual URLs.
- Use filters such as date, country, device, query, page, and search appearance to investigate differences.
- Compare equivalent time periods when evaluating changes.
Search Console provides clicks, impressions, CTR, and average position together and allows the data to be grouped by dimensions such as queries and pages.
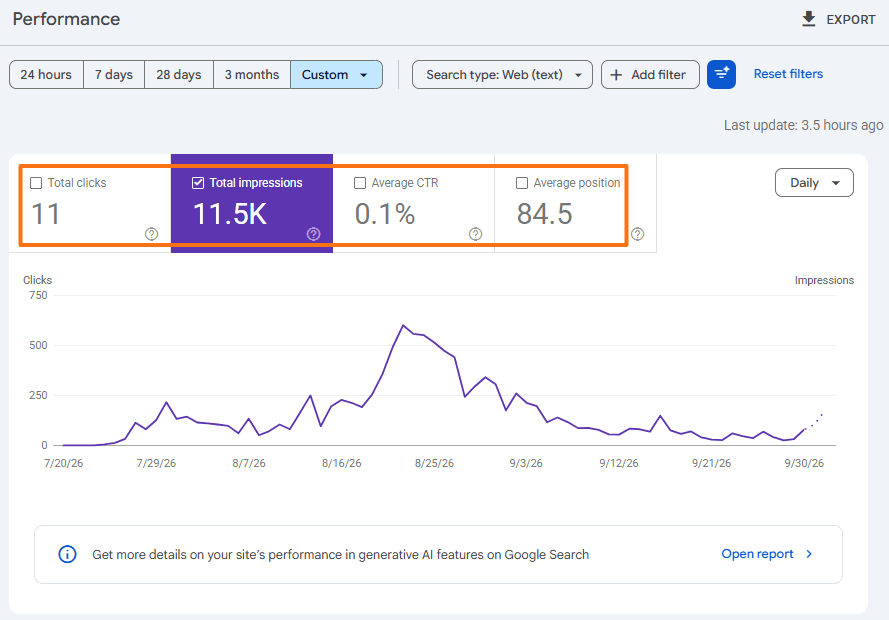
A useful starting point is to identify high-impression queries with relatively low CTR. These queries already provide visibility, so ranking position, search intent, title links, snippets, and SERP competition can then be examined for possible improvements.
Frequently Asked Questions
What is Click-Through Rate (CTR) and how is it calculated?
CTR is the percentage of impressions that result in clicks. It is calculated by dividing clicks by impressions and multiplying the result by 100: CTR = (Clicks ÷ Impressions) × 100. For example, 500 clicks from 10,000 impressions produce a 5% CTR.
Why can search impressions rise sharply while CTR falls?
A page may begin appearing for many more queries or in additional lower-ranking positions, causing impressions to grow faster than clicks. Increased search demand, broader query coverage, changes in ranking positions, AI Overviews, other SERP features, and device differences can also produce rising impressions alongside a falling CTR.
How are Google AI Overviews and featured snippets affecting CTR?
Their effect depends on the query and search-result layout, but AI-generated answers can reduce the need to click another result. A Pew Research Center analysis of March 2025 browsing behavior found that users clicked a traditional search result on 8% of visits where an AI summary appeared, compared with 15% of visits without one.
Featured snippets can also change how clicks are distributed because they provide information directly on the SERP and occupy prominent screen space. Their effect is not uniform: some queries may generate more attention for the featured source, while others may satisfy the search without requiring a click.
What can a low CTR help diagnose?
Low CTR can point toward weak ranking positions, search-intent mismatch, uncompetitive title links or snippets, strong competing results, SERP features, or device-specific differences. It should therefore be treated as a diagnostic signal rather than proof of one particular SEO problem.