
Key Takeaways
- Lighthouse is a free, open-source auditing tool that evaluates individual webpages for performance, SEO, accessibility, best practices, and other quality factors.
- Its SEO score covers limited technical conditions, not content usefulness, backlinks, search intent, rankings, or overall organic performance.
- Lighthouse primarily provides controlled lab data, while PageSpeed Insights combines Lighthouse diagnostics with real-user CrUX field data when available.
- Performance scores help prioritize technical improvements, but meaningful user-experience gains matter more than pursuing a perfect numerical score.
Lighthouse is a free, open-source, automated auditing tool that evaluates individual webpages and identifies opportunities to improve performance, accessibility, technical SEO, development best practices, and other aspects of webpage quality.
Lighthouse is built into Chrome DevTools, but it is not limited to the DevTools panel; it can also be run through PageSpeed Insights, Lighthouse CI, and browser-extension workflows. Lighthouse 13, for example, is available as a browser extension for both Chrome and Firefox.
A Lighthouse audit can be particularly useful at several stages of website development and maintenance:
- Before a Website Launch: To identify technical, performance, accessibility, and SEO issues before the site goes live.
- After a Redesign: To check whether design or structural changes introduced new problems.
- After Theme or Plugin Changes: To detect performance or compatibility issues caused by new code or functionality.
- When a Page Behaves Unexpectedly: To investigate slow loading, layout shifts, script problems, or other unusual behavior.
- During Periodic Technical Audits: To catch regressions and maintain consistent webpage quality over time.
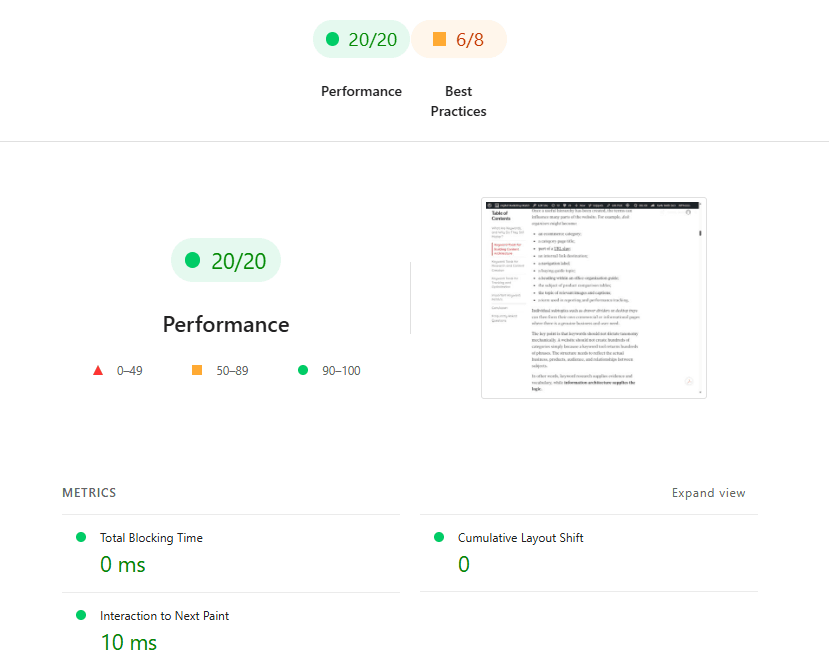
For deeper investigation of a performance problem identified by Lighthouse, Chrome recommends using the DevTools Performance panel, which provides more detailed traces and debugging information.
Chromium-Based Browsers
The built-in Lighthouse DevTools panel is available in Chromium-based browsers, including Google Chrome, Microsoft Edge, Brave, and Opera, which are built on the open-source Chromium project. Mozilla Firefox uses the Gecko rendering engine and SpiderMonkey JavaScript engine, while Apple Safari uses WebKit, so neither browser provides the Chromium Lighthouse DevTools panel.
Lighthouse can also be used as a browser extension. Google currently provides Lighthouse extensions for Chrome and Firefox, allowing Firefox users to run Lighthouse even though it is not built into Firefox Developer Tools. Safari does not currently have an official Google Lighthouse extension or built-in Lighthouse panel; Safari users can instead audit a public webpage through PageSpeed Insights, which uses Lighthouse for its lab analysis.
Main Audit Categories of Lighthouse
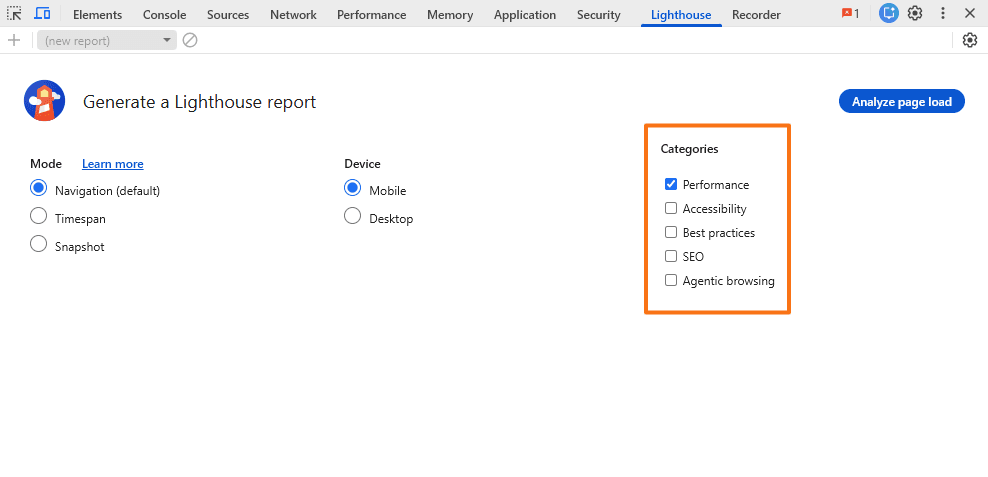
Current Lighthouse reports can examine several different aspects of a webpage. The first four are established Lighthouse categories, while Agentic Browsing is a newer experimental category.
1. Performance
The Performance audit measures how quickly and smoothly a webpage loads and renders.
It evaluates metrics and diagnostics related to visual loading, main-thread blocking, layout stability, image delivery, JavaScript execution, resource loading, and network dependencies. The resulting Performance score can help identify technical bottlenecks that make a page feel slow.
2. Accessibility
The Accessibility audit checks automatically testable accessibility issues that can affect people using assistive technologies or experiencing other accessibility barriers.
Checks can include color contrast, accessible names, form labels, document structure, ARIA implementation, and other machine-testable requirements.
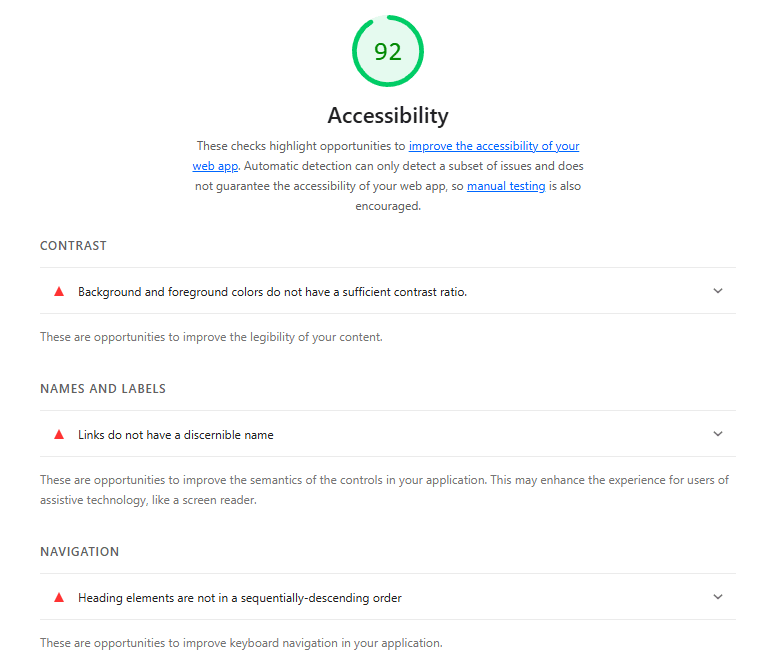
A high Lighthouse Accessibility score does not prove complete WCAG compliance. Many accessibility requirements, such as whether alternative text meaningfully describes an image, require human judgment and manual testing.
3. Best Practices
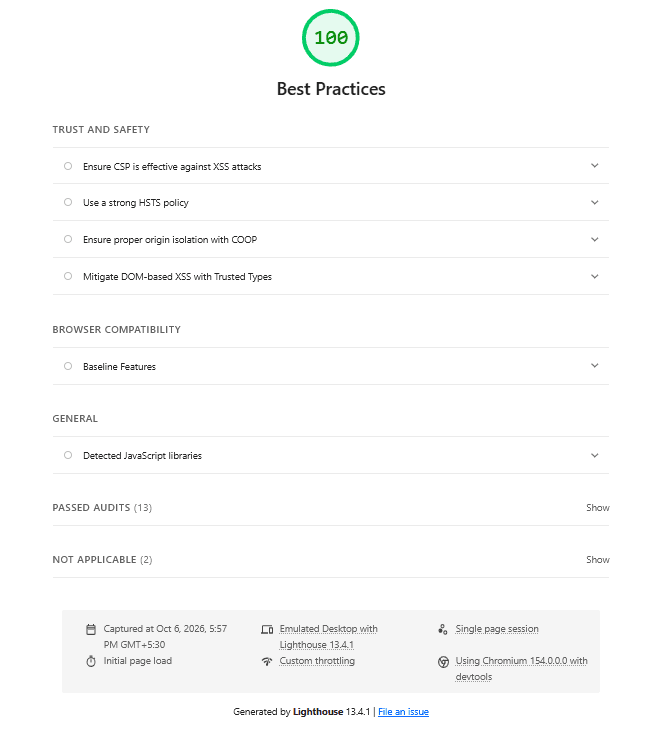
The Best Practices category checks whether the webpage follows selected modern web-development and browser-security practices.
It can identify issues involving deprecated browser APIs, insecure implementation patterns, browser errors, image quality, source maps, and other technical practices that may affect reliability or user experience.
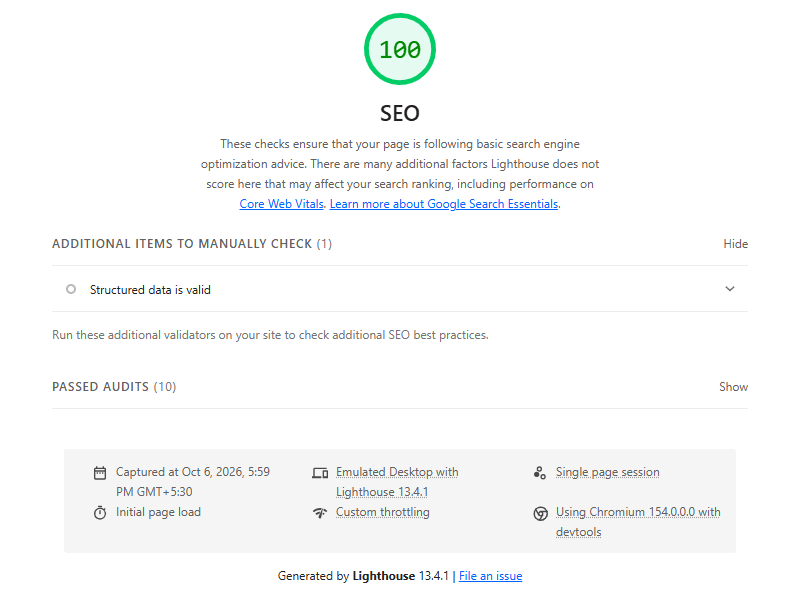
4. SEO
The SEO audit checks basic technical conditions that can help search engines access and understand a webpage. It examines a limited collection of issues such as crawlability, indexing-related elements, page titles, links, and mobile-related requirements.
The Lighthouse SEO score is not a Google ranking score and is not a complete SEO audit. It does not evaluate factors such as content usefulness, backlinks, search intent, topical coverage, competitive rankings, or overall organic performance.
5. Agentic Browsing
Starting with Chrome 150 (M150), the Lighthouse configuration panel includes an experimental Agentic Browsing category. It evaluates whether a website provides predictable, machine-readable signals that can help AI agents understand and interact with the page.
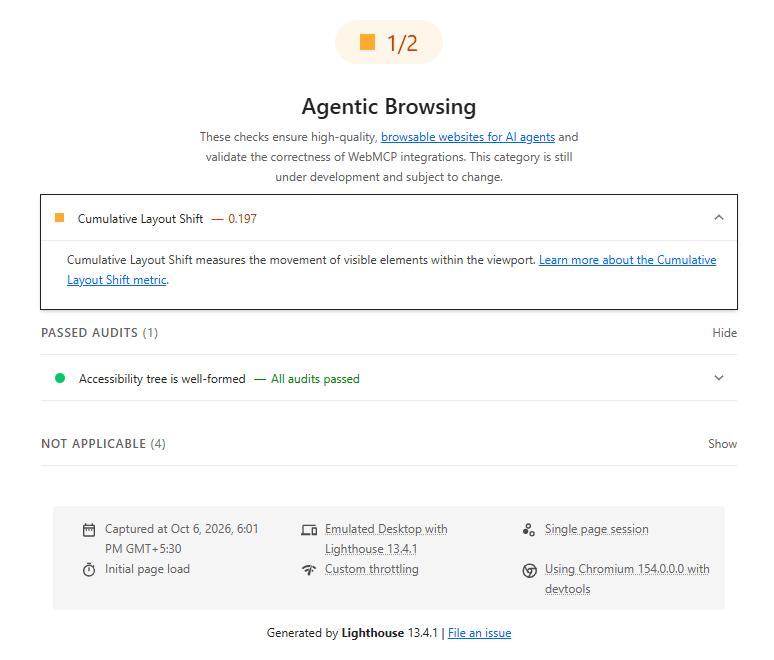
The Agentic Browsing audit currently focuses on three broad areas:
- Accessibility for Agents: Checks selected accessibility-tree requirements that help AI agents identify and interact with webpage controls and content.
- Stability and Discoverability: Uses Cumulative Layout Shift (CLS) to identify unexpected movement that could interfere with an agent’s actions, and checks for an
llms.txtfile at the domain root as a machine-readable discoverability signal. - WebMCP Integration: Checks for registered WebMCP tools and related implementation signals that can expose website functionality to AI agents. WebMCP support is currently experimental and based on a proposed web standard.
WebMCP Tools
WebMCP (Web Model Context Protocol) tools are structured, developer-defined functions or annotated HTML forms exposed by a webpage that in-browser AI agents can discover and execute. These tools can support actions such as search, adding products to a cart, or booking an appointment.
Instead of requiring an AI agent to interpret raw HTML, locate interface elements, or simulate human clicks and navigation, WebMCP allows the website to act as an in-page tool provider.
Audit Modes in Lighthouse
Lighthouse provides three audit modes, with each mode designed for a different type of page analysis.
Navigation mode analyzes a page during a full page load and is the standard choice for measuring loading performance, accessibility, SEO, and best practices. Timespan mode measures activity over a selected period while interactions are performed, making it useful for evaluating user flows and responsiveness. Snapshot mode analyzes the page in its current state without reloading it, which is useful for checking accessibility and other issues in dynamically displayed content.
PWA Testing
Progressive Web App testing in Lighthouse has been deprecated. Agentic Browsing is a separate new category rather than a renamed PWA audit, and it does not test whether a website is installable as an app.
Lighthouse Scoring
Lighthouse converts many audit results into scores that help identify where a webpage performs well and where improvements may be needed.
How Lighthouse Performance Scoring Works
The Lighthouse Performance score ranges from 0 to 100. Chrome’s Lighthouse documentation groups and color-codes the scores as:
- 90–100 (green): Good
- 50–89 (orange): Needs Improvement
- 0–49 (red): Poor
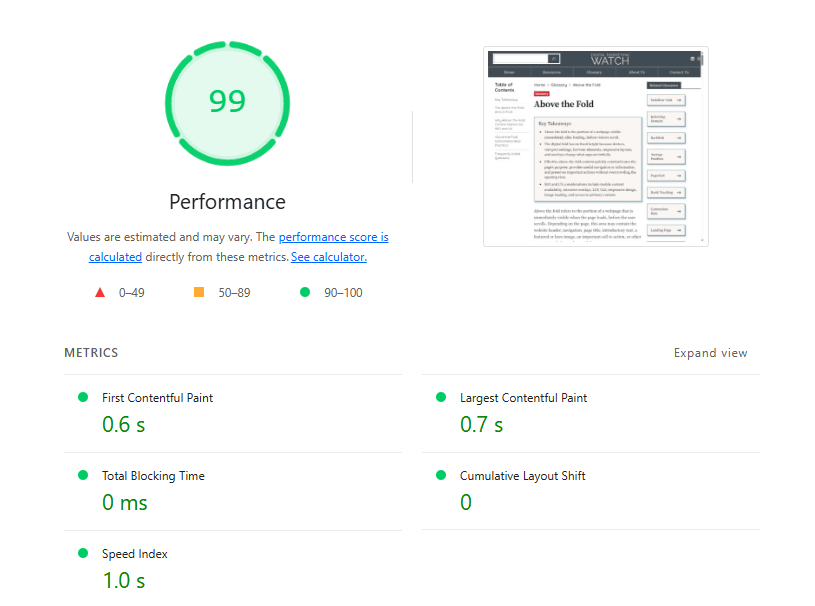
The Performance score is not a simple average. Lighthouse assigns different weights to the individual performance metrics used to calculate the overall score.
For example, improving Total Blocking Time, which carries a 30% weight, can potentially influence the Performance score more strongly than an equivalent scoring improvement in First Contentful Paint.
Lab Data vs. Field Data
Lighthouse primarily produces lab data. It tests the webpage under controlled or simulated conditions so developers can reproduce performance problems and investigate their causes.
The result can still vary between tests because of factors such as computer performance, network conditions, browser extensions, antivirus software, background processes, and server response variations. Google therefore recommends thinking of performance as a “distribution of scores” rather than relying on one isolated score.
Field data measures experiences from real users. Google’s Chrome User Experience Report (CrUX) provides aggregated real-world performance data, including the Core Web Vitals, from eligible Chrome users.
PageSpeed Insights combines both types of information: CrUX provides field data showing what real users experienced, while Lighthouse provides a controlled lab test and technical diagnostic information.
Note
The Lighthouse Performance score itself is not a Google ranking score. For Core Web Vitals, real-user field measurements provide the relevant real-world performance assessment rather than one individual Lighthouse test.
Common Lighthouse Warning Flags and Performance Insights
Lighthouse identifies technical conditions that may be slowing a webpage or creating instability. Lighthouse 13 consolidated several older Performance audits into a newer set of Performance Insights, so the wording may differ from screenshots or tutorials created with older Lighthouse versions.
1. Image Delivery Problems
- Improve Image Delivery: Identifies images that could potentially use fewer bytes through better compression, appropriate dimensions, or modern formats such as WebP or AVIF. Lighthouse 13 consolidated several older image audits, including Properly size images, into this broader insight.
Serving an image substantially larger than its rendered dimensions also wastes bandwidth, particularly on mobile connections.
2. Code and Script Execution Problems
- Render-Blocking Requests: CSS or JavaScript required before the initial render can delay when content first appears. Noncritical resources may sometimes be deferred, reduced, or loaded outside the critical rendering path.
- Unused JavaScript or CSS: Themes, plugins, libraries, and sitewide bundles can send code that a particular page does not need, increasing download and processing work.
- Main-Thread Work: Heavy JavaScript execution, style calculations, layout work, and rendering can occupy the browser’s main thread and reduce responsiveness.
3. Server and Network Problems
- Document Request Latency: Lighthouse can flag delays involving the initial HTML request, including redirects, slow server responses, or missing compression. Lighthouse 13 moved the older Reduce initial server response time audit into this newer insight.
Possible causes include application processing, database work, network latency, insufficient caching, hosting limitations, or redirects.
A CDN can help in some situations, particularly by reducing network distance or caching content closer to users, but a high server-response time does not automatically mean a CDN is required.
4. Layout and Dependency Problems
- Images Missing Explicit Dimensions: Images without appropriate
widthandheightinformation can make it harder for the browser to reserve space before they load, potentially contributing to unexpected layout shifts. - Layout Shift Culprits: Lighthouse can identify elements responsible for unexpected movement that contributes to Cumulative Layout Shift (CLS).
- Network Dependency Tree: This insight identifies important resource chains in which one request depends on another before rendering can proceed. It replaces the older Avoid chaining critical requests audit in Lighthouse 13.
Shorter dependency chains, earlier discovery of critical resources, and deferring unnecessary resources can help reduce these delays.
Running a Google Lighthouse Audit
Lighthouse can be run directly from Chrome DevTools without installing a separate extension.
Step 1: Open the Webpage
Open the webpage to be tested in Google Chrome.
Step 2: Open Chrome DevTools
Right-click on the webpage and select Inspect.
Keyboard shortcuts can also be used:
- Windows/Linux: Ctrl + Shift + I or F12
- Mac: Cmd + Option + I
Step 3: Open the Lighthouse Panel
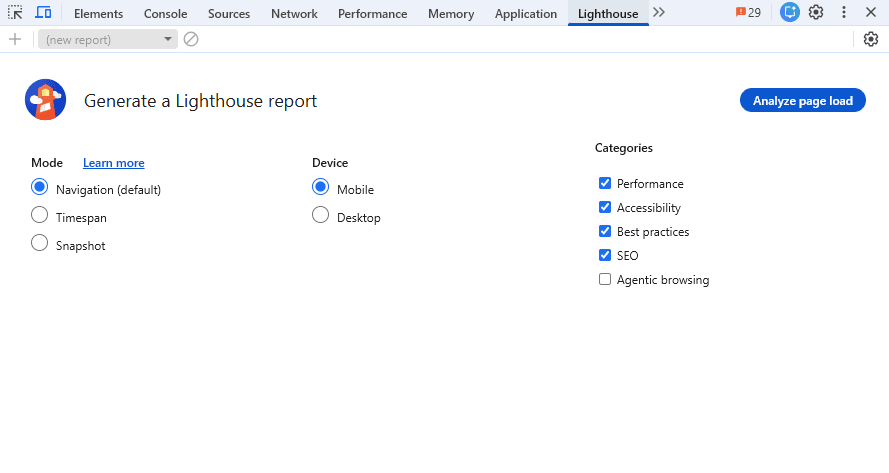
Open the Lighthouse tab in the DevTools panel. If the tab is not immediately visible, open it through the additional DevTools tabs.
Step 4: Configure the Audit
Choose the required test settings.
For a normal page-load audit:
- Mode: Navigation
- Device: Mobile or Desktop
- Categories: Performance, Best Practices, Accessibility, SEO, and Agentic Browsing where appropriate
The Agentic Browsing checkbox is available in Chrome 150 but is currently disabled by default.
Step 5: Analyze the Page
Click Analyze page load.
Lighthouse reloads the webpage, performs the selected audits, and generates an interactive report containing scores, metrics, Performance Insights, diagnostics, passed audits, and opportunities for improvement. A Lighthouse audit usually takes several seconds to complete, although testing time varies by page, device, and test environment.
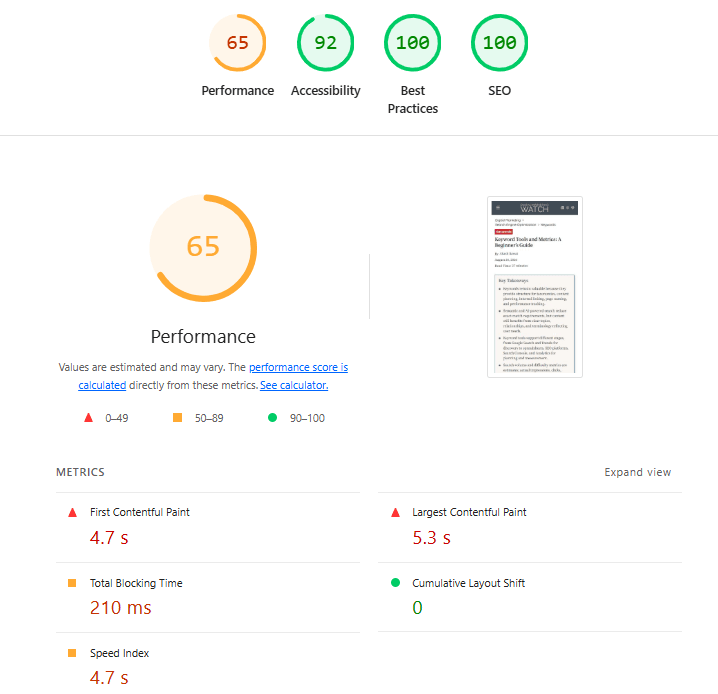
A useful testing workflow is:
The goal should be to resolve meaningful problems rather than repeatedly changing a website simply to achieve a perfect score.
Frequently Asked Questions
What is the main difference between Google Lighthouse and PageSpeed Insights?
Lighthouse performs a controlled lab audit and provides technical diagnostics, while PageSpeed Insights combines Lighthouse lab testing with real-user CrUX field data when enough field data is available. This makes PageSpeed Insights useful for comparing real-world experience with Lighthouse’s diagnostic test.
Does achieving a perfect 100/100 Lighthouse score guarantee higher Google rankings?
No. Lighthouse is a diagnostic tool, not a search-ranking score. A perfect score does not guarantee higher rankings, and website owners should prioritize meaningful improvements to user experience rather than optimizing solely for a numerical Lighthouse result.
Why do Lighthouse scores fluctuate even when no changes have been made on the website?
Lighthouse results can vary because the test environment also changes. CPU load, network conditions, browser extensions, antivirus software, server response times, advertisements, and background processes can all influence an individual test. Running several comparable tests provides a more useful picture than relying on one result.
Why does a website load fast for a user but receive a poor Lighthouse Performance score?
A familiar website may load quickly on a powerful computer, fast internet connection, and warm browser cache. Lighthouse deliberately tests under controlled or simulated conditions designed to expose performance bottlenecks that may be more noticeable for users on slower connections or less powerful devices.