
Google PageSpeed Insights (PSI) is a free, web-based tool that analyzes the performance of an individual webpage and provides both real-world user-experience data and controlled laboratory diagnostics for mobile and desktop.
When a URL is submitted, PageSpeed Insights combines two different sources of performance information. Chrome User Experience Report (CrUX) data shows how real users have experienced the page or origin over time, while Lighthouse runs a controlled lab test to identify technical performance problems and improvement opportunities.
The familiar 0–100 Performance score in PageSpeed Insights comes from Lighthouse’s lab test rather than from the real-user field data. Lighthouse groups the Performance score as:
- 90–100: Good
- 50–89: Needs Improvement
- 0–49: Poor
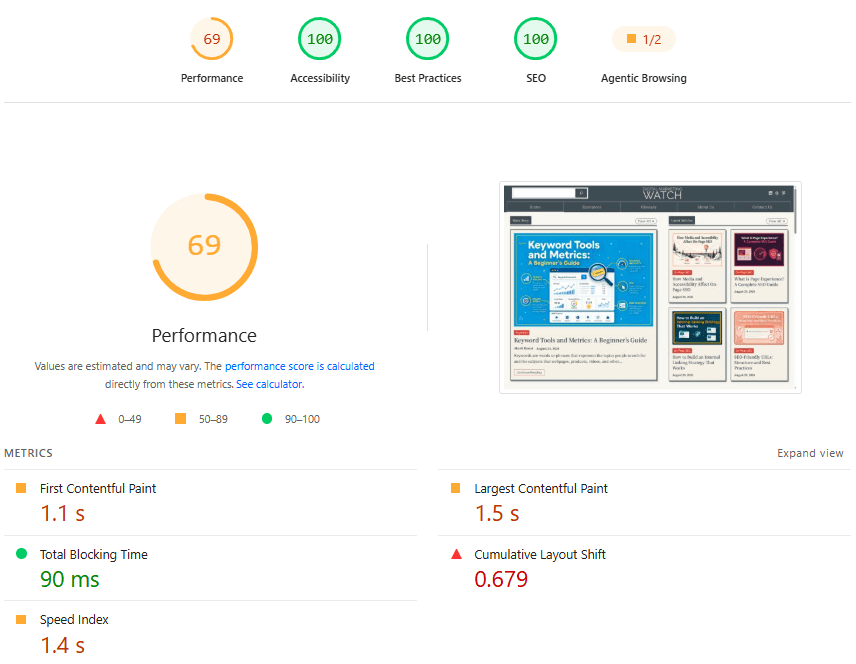
PageSpeed Insights evaluates one submitted URL at a time. If there is not enough page-level real-user data, the field-data section may sometimes show broader origin-level data instead.
PageSpeed Insights vs. Lighthouse
Lighthouse is the auditing engine that performs controlled lab testing and provides technical diagnostics. It also audits Accessibility, Best Practices, SEO, and Agentic Browsing through Chrome DevTools, which can be opened with Ctrl + Shift + I on Windows/Linux, or through the Lighthouse browser extension. PageSpeed Insights is Google’s web-based service that uses Lighthouse for lab analysis and also integrates CrUX field data showing how real users have experienced the page or origin.
How PageSpeed Insights Works: Field Data vs. Lab Data
PageSpeed Insights is useful because it combines two different views of performance: what real users experienced over time and what a controlled test finds right now.
Field Data: Real-World User Experience
Field data comes from the Chrome User Experience Report (CrUX). CrUX contains aggregated performance measurements collected from eligible Chrome users who have visited websites in real-world conditions. In PageSpeed Insights, this data is generally shown over a rolling 28-day period.
Field data can include metrics such as Largest Contentful Paint (LCP), Interaction to Next Paint (INP), Cumulative Layout Shift (CLS), First Contentful Paint (FCP), and Time to First Byte (TTFB).
Field data reflects real devices, network conditions, locations, and browsing environments, so it can reveal problems that may not appear during a single controlled test.
Core Web Vitals are used within Google’s ranking systems, and PSI’s CrUX section reports real-user measurements for those same metrics. However, passing Core Web Vitals does not guarantee higher rankings, because Google evaluates many other signals.
Lab Data: Controlled Diagnostics
Lab data is generated by Lighthouse when the PSI test is run. Unlike field data, which summarizes real-user experiences over time, lab data analyzes the page under a defined test environment at that moment. It provides the Lighthouse Performance score, individual performance metrics, diagnostic findings, Performance Insights, and recommendations for improving the page.
Lab testing is particularly useful for identifying why a page may be slow and testing whether technical changes improve the result.
A simple way to remember the difference is:
- Field Data: What are real users experiencing?
- Lab Data: What technical problems can be reproduced and investigated now?
A page can perform differently in the two datasets because they measure different conditions.
Core Web Vitals in PageSpeed Insights
The field-data section of PageSpeed Insights evaluates the three Core Web Vitals, which measure loading performance, responsiveness, and visual stability.
Largest Contentful Paint
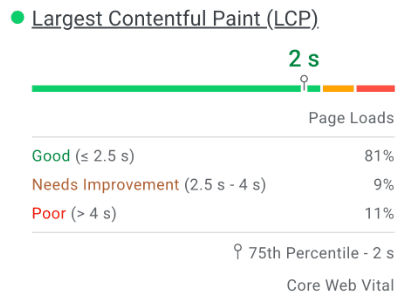
Largest Contentful Paint (LCP) measures loading performance by identifying when the largest eligible content element within the viewport finishes rendering.
- Good LCP Score: 2.5 seconds or less.
The LCP element is commonly a large image, hero graphic, heading, or text block, but Google applies specific eligibility rules when determining the element.
Interaction to Next Paint
Interaction to Next Paint (INP) measures how responsive a webpage is to user interactions.
It evaluates the latency associated with interactions such as clicks, taps, and keyboard input and reports a representative value for the page’s overall responsiveness.
- Good INP Score: 200 milliseconds or less.
Cumulative Layout Shift
Cumulative Layout Shift (CLS) measures visual stability by quantifying unexpected movement of visible content while a page is being used.
For example, text or buttons shifting because an image or advertisement loads without reserved space can contribute to CLS.
- Good CLS Score: 0.1 or less.
Google evaluates Core Web Vitals at the 75th percentile of page loads, meaning the page should meet the recommended threshold for at least 75% of qualifying user experiences.
Passing the Core Web Vitals Assessment
PageSpeed Insights can show whether a URL or origin passes the Core Web Vitals assessment based on available field data.
This assessment should not be confused with the Lighthouse 0–100 Performance score. A page can pass its real-world Core Web Vitals assessment while receiving a lower Lighthouse score, or vice versa.
How to Check and Interpret a PageSpeed Insights Report
PageSpeed Insights can be used without installing software or a browser extension.
Step 1: Open PageSpeed Insights
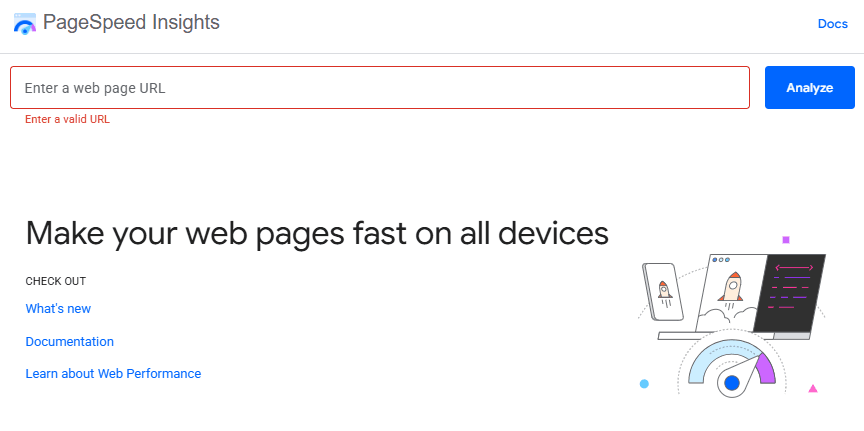
Open PageSpeed Insights, enter the full URL of the webpage to test, and select Analyze.
Step 2: Check Mobile and Desktop Results
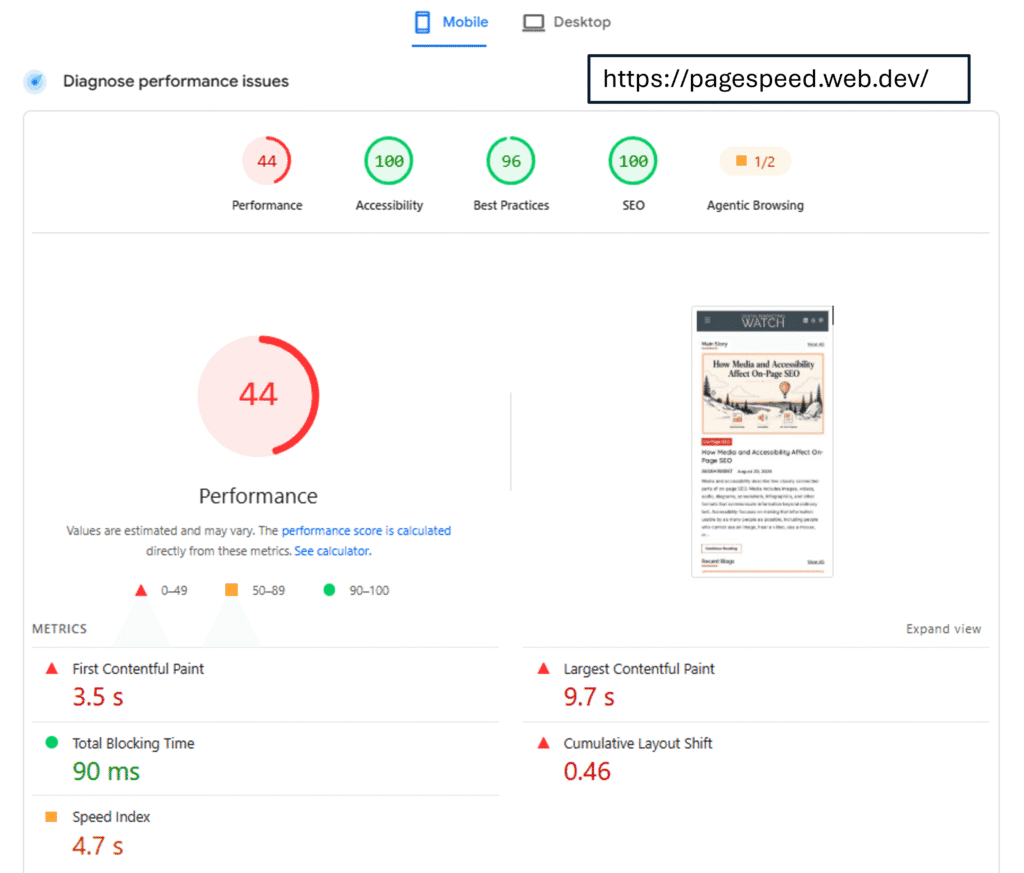
PageSpeed Insights provides separate Mobile and Desktop views.
Results can differ because users experience webpages on different hardware, screen sizes, and network conditions. Lighthouse also uses different test configurations for mobile and desktop.
Step 3: Review Real-User Experience
Start with the field-data section to see what real users experienced, including the Core Web Vitals assessment, LCP, INP, CLS, and supporting metrics such as FCP and TTFB.
If the page does not have enough CrUX data, PSI may display origin-level information instead.
Step 4: Review the Lighthouse Performance Score
Then examine the lab-based Performance score.
- 90–100: Good
- 50–89: Needs Improvement
- 0–49: Poor
The score is a weighted calculation derived from Lighthouse performance metrics. It is a diagnostic score rather than a direct Google ranking score.
Step 5: Review Performance Insights
The recommendations beneath the score help identify likely technical causes of poor performance.
This is where PSI becomes actionable. Instead of only indicating that a page is slow, it can point toward image delivery, JavaScript, CSS, server response, rendering, layout, or network problems that deserve investigation.
The goal should be to fix meaningful user-experience problems rather than chase a perfect 100/100 score.
Common Ways to Improve PageSpeed Insights Results
PageSpeed improvements should focus on the issues that materially affect loading, responsiveness, and stability.
- Improve Image Delivery: Resize oversized images, compress them appropriately, and use efficient formats such as WebP or AVIF where suitable. Responsive images can also prevent unnecessarily large files from being delivered to smaller screens.
- Lazy-Load Below-the-Fold Media: Images, videos, maps, and embeds below the initial viewport can often be deferred until needed. Important above-the-fold or LCP images should generally not be lazy-loaded.
- Reduce Render-Blocking Resources: Noncritical CSS and JavaScript can delay the browser from rendering important content. Where appropriate, defer, split, or reorganize these resources.
- Reduce Unused JavaScript and CSS: Themes, plugins, libraries, and third-party integrations may load code that the current page does not need.
- Improve Initial Server Response: Slow application processing, database queries, redirect chains, weak caching, or network latency can delay the initial HTML response. Better hosting or a CDN may help in some cases, but a CDN is not the universal solution to high TTFB.
- Reduce Excessive DOM Complexity: Very large or deeply nested page structures can increase browser processing and rendering work.
- Limit Third-Party Scripts: Advertising platforms, analytics tags, chat widgets, social embeds, and other external scripts can add network requests and JavaScript execution.
- Prioritize Above-the-Fold Content: Critical text, styles, fonts, and important hero media should be delivered efficiently so the initial viewport can render quickly.
- Reserve Space for Images and Embeds: Appropriate image dimensions and aspect ratios help prevent unexpected movement and improve CLS.
- Use Caching and Compression: Effective browser caching and transfer compression can reduce repeated downloads and network payloads.
Current Lighthouse versions consolidate several older diagnostics into broader Performance Insights, so newer PSI reports may use labels such as Improve image delivery, Render-blocking requests, Document request latency, Optimize DOM size, and Network dependency tree rather than terminology found in older tutorials.
For broader sitewide monitoring, Google Search Console’s Core Web Vitals report groups pages with similar performance characteristics and can help identify issues affecting multiple URLs.
Frequently Asked Questions
What is a good PageSpeed Insights score?
For the Lighthouse Performance score, 90–100 is Good, 50–89 Needs Improvement, and 0–49 is Poor. The score should still be interpreted alongside real-user Core Web Vitals rather than used as the only measure of page performance.
Does PageSpeed Insights test the whole website or just one page?
PageSpeed Insights analyzes the specific URL submitted. Field data may sometimes fall back to origin-level information, but a single PSI test is not a complete sitewide performance audit.
What is the difference between Mobile and Desktop scores?
Mobile and desktop tests use different device and performance conditions, and real users may also experience the webpage differently across form factors. It is therefore normal for the two results to differ.
Why do PageSpeed scores change between test runs?
PageSpeed scores can vary between test runs because lab measurements can be affected by temporary differences in server response, network conditions or routing, test-environment resource contention, and dynamic content such as ads or third-party resources. Running several comparable tests provides a more reliable picture than relying on a single score.
Does a 100/100 PageSpeed score guarantee higher Google rankings?
No, the Lighthouse Performance score is not a direct ranking score. Core Web Vitals are used within Google’s ranking systems, but Google considers many additional signals when ranking webpages.
What is the difference between Field Data and Lab Data?
Field data comes from real-user CrUX experiences collected over time. Lab data comes from a controlled Lighthouse test performed when the URL is analyzed.
How do third-party scripts affect PageSpeed scores?
Third-party scripts can add network requests, JavaScript execution, main-thread work, rendering delays, and layout changes, potentially affecting performance metrics such as LCP, Total Blocking Time, and CLS.