
Key Takeaways
- Google Analytics 4 is Google’s current analytics platform for measuring user behavior across websites and mobile apps.
- GA4 uses an event-based model, recording interactions such as pageviews, downloads, purchases, scrolls, and custom actions.
- GA4 setup includes creating a property, connecting a data stream, installing the Google tag, configuring retention, and filtering internal traffic.
- GA4 measures behavior after users arrive, while Google Search Console focuses on search visibility, indexing, crawling, clicks, impressions, and rankings.
Google Analytics 4 (GA4) is Google’s current analytics platform for measuring how users discover and interact with websites and mobile apps. It records interactions such as page views, clicks, downloads, and purchases as events, while sessions are built from sequences of user activity.
Google Analytics did not begin with GA4. Google acquired Urchin in 2005 and launched Google Analytics later that year. Universal Analytics (UA) was introduced in limited beta in 2012, and expanded to public beta in 2013, allowing users to test the new platform. It became Google’s standard analytics platform in 2014, and was eventually replaced by GA4.
Google made GA4 the default property type on October 14, 2020. Standard Universal Analytics properties stopped recording new data from July 1, 2023, with Universal Analytics 360 properties following suit in 2024.
GA4 differs from Universal Analytics because it organizes measurement primarily around events rather than the older hit- and session-centered reporting model. Google describes GA4 as its current generation of Analytics designed around event-based measurement across websites and apps.
How to Set Up Google Analytics 4
GA4 setup involves creating a property, connecting a data stream, installing the Google tag, and configuring important measurement settings.
Step 1: Create a GA4 Property
Sign in to Google Analytics, open Admin, and select the option to create a new property. Enter the required details, including Property Name, Reporting Time Zone, Currency, Business Details, and Business Objectives.
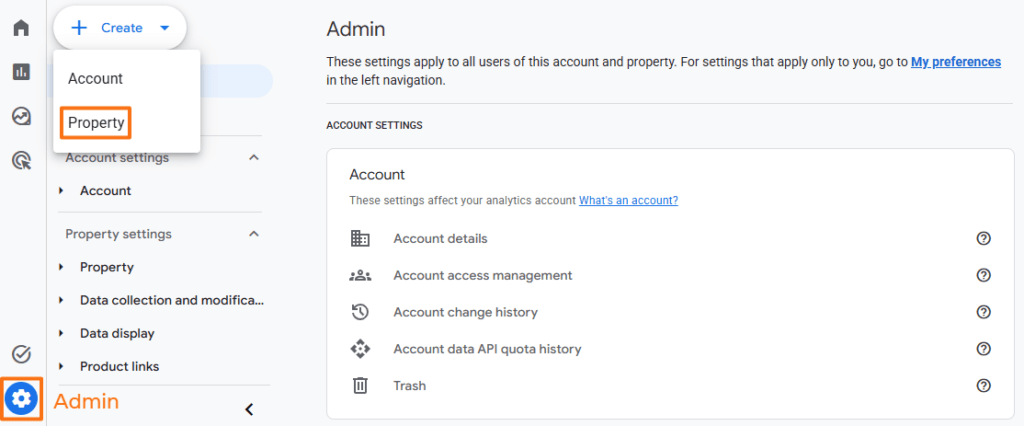
The reporting time zone and currency should reflect the way the organization normally reports and evaluates business performance.
Step 2: Create a Web Data Stream
In Admin, navigate to Data collection and modification → Data streams, then add a Web stream. Enter the website URL and a descriptive stream name.
GA4 also provides Enhanced Measurement, which can automatically collect several common interactions without requiring additional event code. Depending on configuration, these can include pageviews, scrolls, outbound clicks, site searches, video engagement, file downloads, and form interactions.
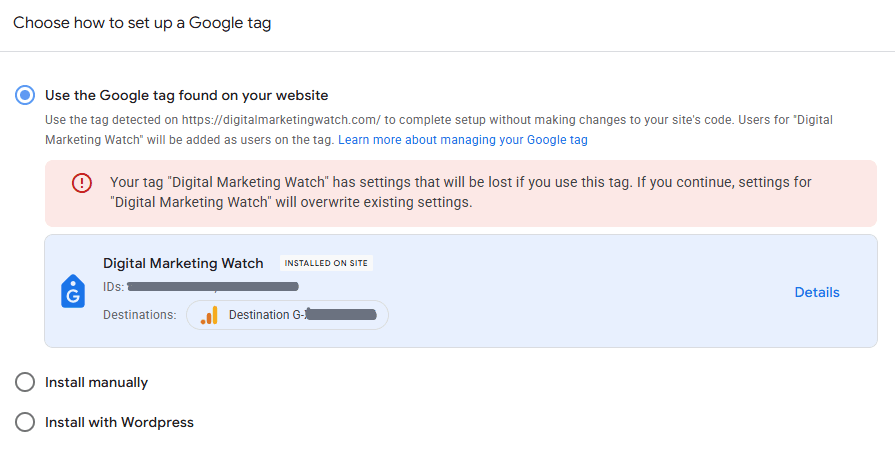
After creating the stream, GA4 provides a unique Measurement ID, usually beginning with G-.
The Google tag must then be installed on the website so activity can be sent to GA4. It can be installed directly in the website code, through Google Tag Manager, or through a supported CMS or analytics integration.
Step 3: Review Data Retention
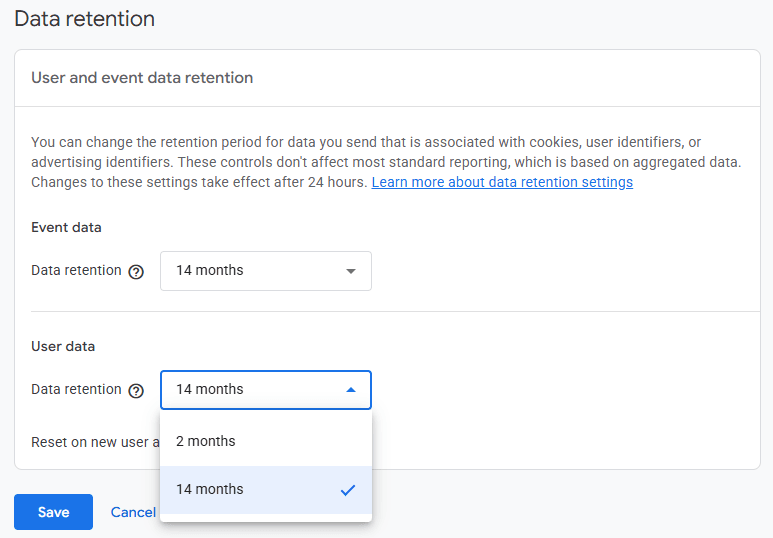
In Admin, navigate to Data collection and modification → Data retention.
Standard GA4 properties generally allow event-level and user-level retention to be set to 2 months or 14 months. For websites that need longer historical analysis in areas such as Explorations, 14 months is usually more useful.
The setting does not affect standard aggregated reports; it primarily affects detailed data available in Explorations and funnel reports.
Step 4: Define and Filter Internal Traffic
Internal visits from employees, agencies, developers, or office networks can distort analytics data if they are not separated from ordinary users. In GA4, define internal traffic through: Admin → Data collection and modification → Data streams → Web stream → Configure tag settings → Define internal traffic
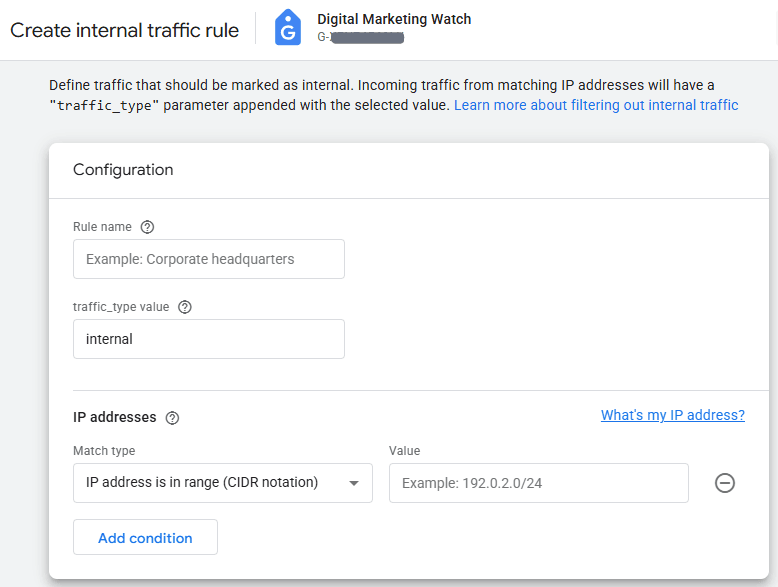
Add the relevant IP address or range.
Defining the traffic is only the first step. A corresponding Internal Traffic data filter must also be configured under: Admin → Data collection and modification → Data filters
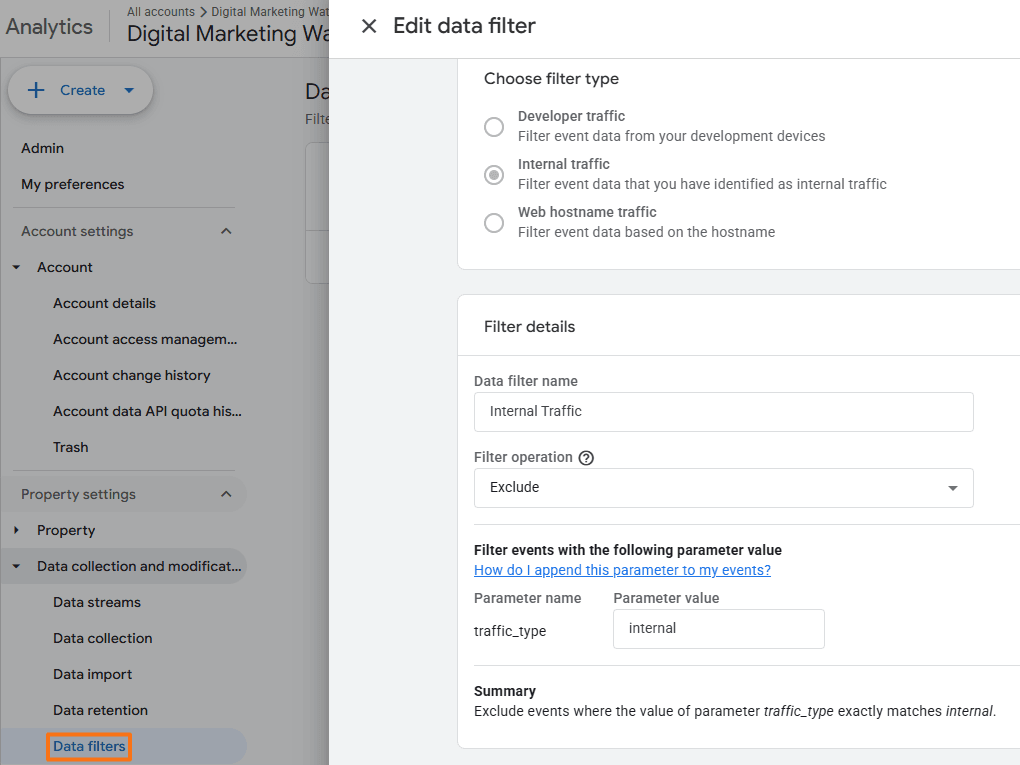
Google recommends testing filters before activating them because an active exclusion prevents matching incoming data from being processed.
Step 5: Connect Google Search Console
GA4 can be linked with a verified Google Search Console property by navigating to: Admin → Product links → Search Console Links → Link
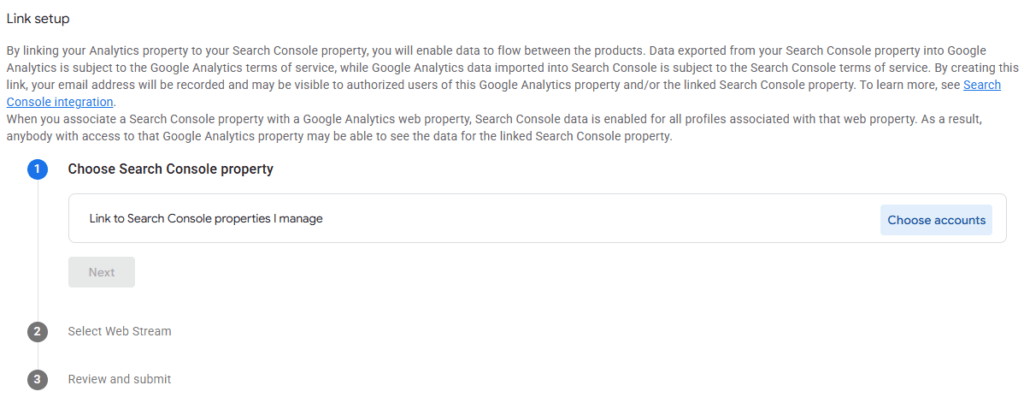
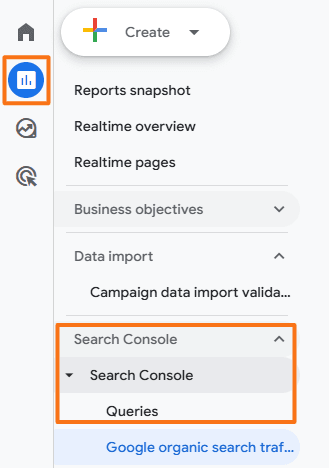
Then select the Search Console property and associated web data stream. After the connection is configured and the relevant report collection is published, GA4 can display Google Organic Search Queries and Google Organic Search Traffic reports.
How GA4 Measures Data and How It Differs From Search Console
GA4 records website and app activity primarily as events. Events can include pageviews, session starts, downloads, purchases, scrolls, form interactions, and custom actions configured for a particular business.
Sessions
A session represents a period of user activity. GA4 can begin a new session when a user visits a website or opens an app without an active session. The default session timeout is 30 minutes of inactivity, although this can be changed.
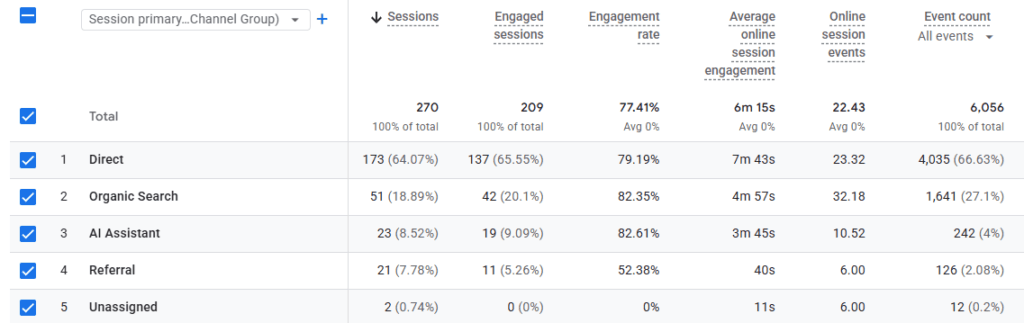
A session can last longer than 30 minutes if activity continues. Unlike Universal Analytics, GA4 doesn’t automatically start a new session simply because the campaign source changes or midnight is reached.
Active Users
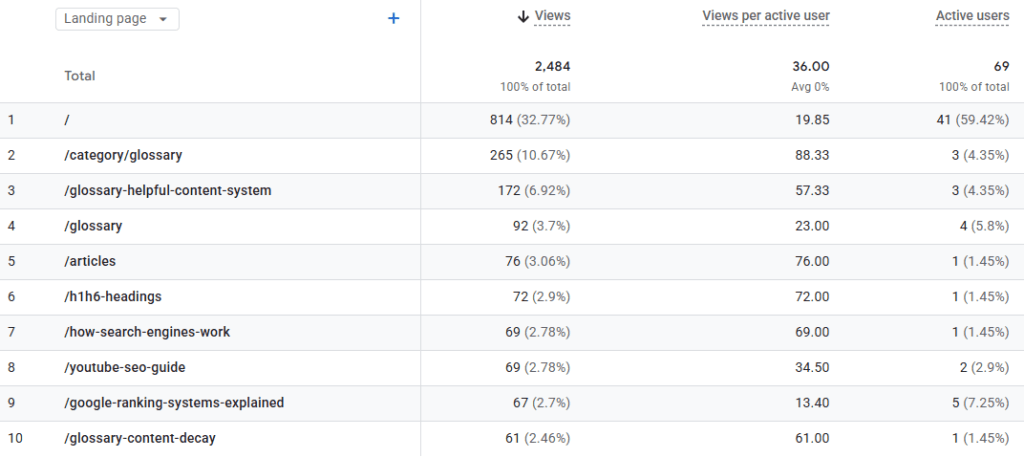
Active Users is GA4’s primary user metric in many standard reports. It represents distinct users who meet Google’s criteria for being active during the selected period, such as users with an engaged session or other qualifying engagement signals. Hence, it is different from simply counting every browser request or every person who loads a page.
Engagement Rate
Engagement rate is calculated as Engagement Rate = Engaged Sessions ÷ Total Sessions
An engaged session is one that:
- continues for more than 10 seconds;
- contains at least one key event; or
- contains at least two page or screen views.
GA4’s bounce rate is the inverse of engagement rate.
GA4 vs. Google Search Console
GA4 and Search Console answer different questions.
Search Console data is not a complete record of every URL on a website because Google may not crawl or report every URL equally. Likewise, GA4 only measures activity that reaches its measurement system.
GA4 standard reports are generally designed to use aggregated, unsampled data, although sampling can still occur for certain large or filtered requests. Thresholding, high-cardinality limits, and approximate distinct counting can also affect reported values.
Important Google Analytics 4 Metrics
GA4 provides many metrics, but a smaller group is particularly useful for routine website and marketing analysis.
- Active Users: Represents the number of distinct users considered active during the selected reporting period.
- Event Count: Shows the total number of times recorded events were triggered. If one visitor generates a
page_view,scroll, andfile_download, each event contributes separately to the total. - Sessions: Represents the number of browsing or app-interaction periods that began during the selected period.
- Engaged Sessions: Counts sessions that lasted longer than 10 seconds, contained at least one key event, or included at least two page or screen views.
- Engagement Rate: Represents the percentage of total sessions that qualified as engaged sessions.
- Average Engagement Time: Measures how long a webpage was actively in focus or an app was in the foreground, rather than simply how long a browser tab remained open.
- Key Events: Represents events marked as particularly important to the business, such as a purchase, lead submission, account signup, subscription, or consultation request. Google previously used the term conversion more broadly in GA4, but current terminology distinguishes key events from advertising conversions.
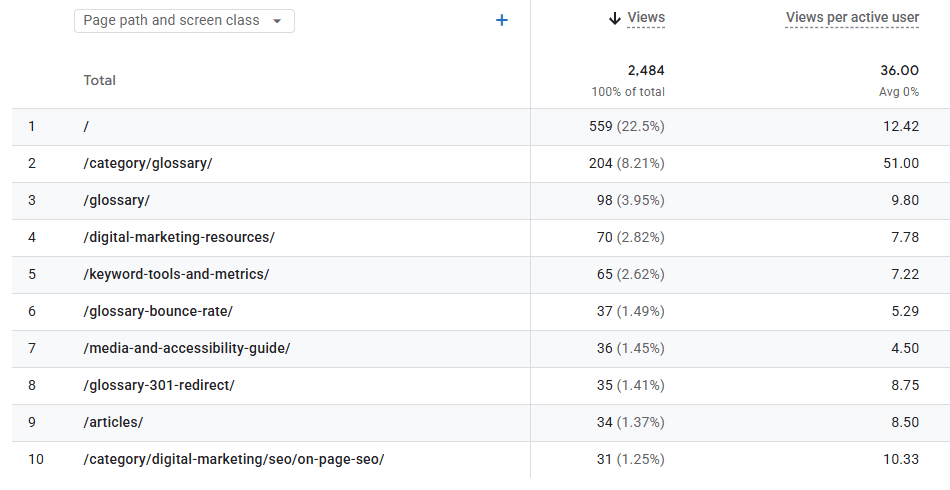
- Views: Represents the total number of webpage and app-screen views, including repeated views of the same page or screen.
- New Users: Represents users who interacted with the property for the first time, based on events such as
first_visitfor websites orfirst_openfor apps. - Total Revenue: Combines supported revenue sources such as ecommerce purchases, subscriptions, in-app purchases, and advertising revenue when properly configured.
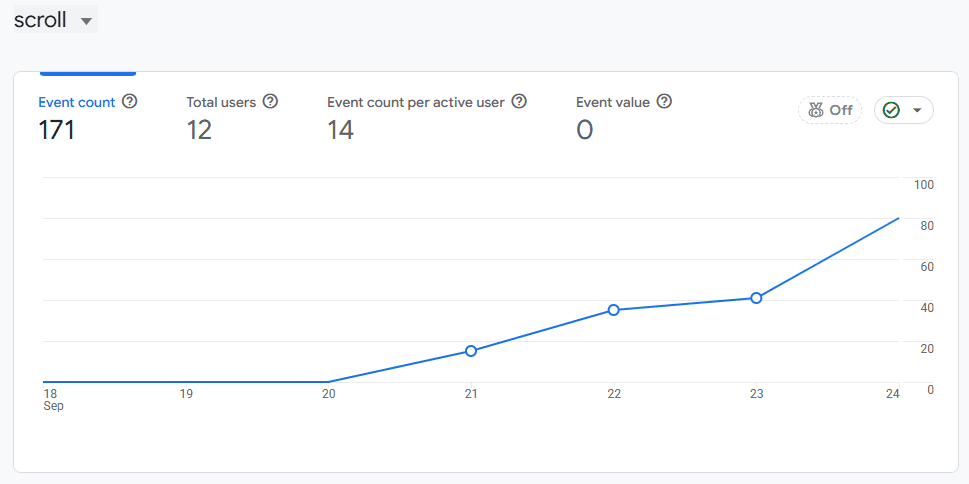
- Scrolls: GA4 Enhanced Measurement’s
scrollevent fires once per page when approximately 90% of the page’s vertical depth becomes visible. - User Lifetime Value: Helps analyze lifetime revenue, engagement, and other behavior for users over their measured relationship with the property.
Predictive Metrics
For properties with sufficient eligible data, GA4 can use machine learning to generate predictive metrics. These can include:
- Purchase Probability: The likelihood that an eligible user will purchase within the next 7 days.
- Churn Probability: The likelihood that an eligible recently active user won’t be active during the next 7 days.
- Predicted Revenue: Expected purchase revenue over the next 28 days.
Predictive metrics only become available when the property has enough qualifying data for Google’s models to meet required quality thresholds.
Important Events Tracked by GA4
An event in GA4 represents a measured interaction or occurrence on a website or app. For example, loading a webpage can generate a page_view event, while completing an ecommerce transaction can generate a purchase event.
Automatically Collected and Enhanced Measurement Events
Several important events can be collected automatically or through Enhanced Measurement.
page_view: Records a webpage view when a page loads and, when appropriately configured, when browser history changes on dynamic websites.session_start: Records the beginning of a new Analytics session.first_visit: Records the first visit from a user in the relevant browser or measurement context.click: Enhanced Measurement records qualifying outbound link clicks, not every click made anywhere on the website.scroll: Fires once per page when 90% of the vertical page depth becomes visible.file_download: Records clicks on links to supported downloadable file types such as PDFs and spreadsheets.form_start: Can record when a user begins interacting with a form.form_submit: Can record when a qualifying form submission occurs.video_start,video_progress, andvideo_complete: Can be collected for supported embedded YouTube videos through Enhanced Measurement.
Enhanced Measurement events can be enabled or disabled individually in the web stream settings.
Ecommerce Events
Google provides recommended ecommerce event names and parameters so ecommerce reports can be populated consistently. Important examples include:
view_item: Records when a user views a product or item.add_to_cart: Records when an item is added to the shopping cart.begin_checkout: Records the start of the checkout process.purchase: Records a completed transaction and can include transaction ID, currency, value, tax, shipping, and item information.
These events normally require ecommerce tracking to be implemented through website code, Google Tag Manager, a CMS integration, or another supported implementation.
Custom Events
Custom events can measure actions that are important to a specific website but are not covered adequately by automatically collected or recommended events. Examples could include cta_click, whatsapp_click, pricing_calculator_complete, and brochure_request.
Custom naming should remain clear and consistent so reports remain understandable over time.
Alternatives and Complements to Google Analytics 4
GA4 is not the only analytics platform available. Some alternatives provide similar traffic and marketing measurement, while other tools specialize more heavily in user behavior.
Direct Analytics Alternatives
Several analytics platforms offer direct alternatives to Google Analytics 4, with a varying degree of focus on privacy, compatibility, and reporting.
- Matomo: An open-source analytics platform with strong privacy and data-control options. The self-hosted version allows organizations to control where their analytics data is stored.
- Adobe Analytics: An enterprise analytics platform designed for advanced segmentation, attribution, and cross-channel customer analysis.
- Heap: A product analytics platform that can automatically capture many interactions and allows teams to analyze user journeys and funnels with less initial event configuration.
Behavioral Analytics Complements
Hotjar, Microsoft Clarity, and Crazy Egg are better viewed as behavioral or experience-analytics tools than direct GA4 replacements. They help explain how visitors interact with individual pages.
- Microsoft Clarity: Provides heatmaps, session recordings, scroll behavior, and behavioral indicators such as rage clicks.
- Hotjar: Combines heatmaps and session recordings with surveys and feedback tools.
- Crazy Egg: Provides heatmaps, scrollmaps, recordings, and its Confetti visualization for analyzing clicks by factors such as traffic source.
These tools can complement GA4 because GA4 focuses more heavily on traffic acquisition, event measurement, attribution, key events, and revenue analysis, while behavioral tools provide more visual detail about how people interact with pages.
Frequently Asked Questions
What does the “4” in Google Analytics 4 actually stand for?
The 4 identifies the newer generation of Google Analytics rather than expanding into a separate phrase. Google generally describes GA4 as its next-generation Analytics property type following Universal Analytics.
What is a key event in GA4?
A key event is an event marked as especially important to a business, such as a purchase, signup, or lead submission. Marking an event as a key event makes it easier to measure important outcomes separately from ordinary interactions.
How long does data stay inside GA4 before it is deleted?
Standard GA4 properties can currently retain user-level and event-level data for 2 or 14 months. This setting primarily affects detailed data used in areas such as Explorations and does not mean standard aggregated reports disappear after the retention period.
What happens if a user leaves a tab open overnight? Does it start a new session?
Leaving a tab open does not keep a session active indefinitely. By default, a session times out after 30 minutes of inactivity. If qualifying activity resumes after that timeout, GA4 can begin a new session.
What is the difference between GA4 and Google Analytics 360?
GA4 is Google’s analytics platform, while Google Analytics 360 is its paid enterprise tier. Analytics 360 provides higher limits, longer retention options, subproperties, roll-up properties, higher-capacity reporting, and other enterprise features.