Key Takeaways
- Scroll depth measures how far visitors progress down a webpage, helping identify where engagement declines and important content or calls to action may be missed.
- Scroll depth is not a documented direct ranking signal, so its SEO value comes from improving content quality, page structure, and user experience.
- Percentage thresholds support comparisons across different page lengths, while pixel thresholds measure fixed vertical positions; device differences require separate analysis.
- Scroll depth does not prove content was read or a specific element was visible, so interpretation should include engagement time, clicks, conversions, and element visibility.
Scroll depth is a behavioral metric that measures how far visitors progress down a webpage during a visit. It can reveal where progression declines and whether important content or calls to action are being reached. Its main SEO value lies in helping publishers improve content and user experience rather than acting as a direct ranking signal.
Google does not document scroll depth as a direct ranking signal, and a high scroll percentage does not automatically improve rankings. At the same time, it does not confirm that the visible content was read or understood. It should therefore be interpreted alongside engagement time, clicks, conversions, and interactions with important page elements.
Diagnostic Signals and Importance of Scroll Depth
Scroll-depth data helps different teams locate engagement declines and investigate whether the cause lies in the content, design, asset placement, or editorial structure.
- Content Creators: Scroll-depth data shows where readers tend to stop progressing. This helps writers strengthen introductions, improve text layout, and add visuals at points where engagement declines.
- UX/UI Teams: A sudden drop in scroll depth may reveal design friction, such as intrusive pop-ups, slow-loading elements, disruptive advertisements, or a false bottom that appears to mark the end of the page.
- Sales and Marketing Teams: Scroll data helps place important product information, promotional links, and calls to action in high-engagement areas before visitor activity falls.
- Editors: Low scroll depth may indicate weak headings, poor formatting, unnecessary length, or important answers appearing too late in the content.
How Is Scroll Depth Measured?
Scroll depth is commonly measured using percentages or pixels. Percentage thresholds record how far a visitor progresses relative to the page’s total height, such as 25%, 50%, 75%, or 90%, making them useful for comparing pages of different lengths. Pixel thresholds record a fixed vertical distance, such as 500 or 2,000 pixels, and may be suitable for fixed-layout pages or specific content positions.
Google Analytics 4 records a standard Enhanced Measurement scroll event when 90% of a page’s vertical depth becomes visible. Additional milestones, such as 25%, 50%, and 75%, require custom tracking, commonly through Google Tag Manager.
Scroll Depth vs. Element Visibility
Reaching 75% of a page does not necessarily prove that a particular CTA, image, or section was actually visible to the visitor. When the goal is to measure whether a specific element appeared on screen, an element-visibility trigger can provide more precise data.
Google Tag Manager has a dedicated Element Visibility trigger that can measure whether a selected element becomes visible and can even require a minimum percentage or amount of time on screen.
Important Measurement Limitation
A table of contents link or another anchor link can take a visitor directly to a lower section of the page. This may trigger a scroll threshold even though the visitor did not view all the content above it. Therefore, scroll depth should be interpreted alongside engagement time, clicks, element visibility, and other interactions.
Cross-Device Differences
Scroll-depth results should be analyzed separately for mobile, tablet, and desktop devices. Responsive websites can display the same content differently according to screen size, and narrower screens often cause text and other elements to occupy more vertical space. Therefore, a 50% scroll depth may not represent the same amount of content exposure across different devices.
What Is a Good Scroll Depth?
There is no universal “good” scroll depth because results depend on page length, layout, content purpose, and the location of important elements such as calls to action. Scroll depth should therefore be compared with the page’s own historical performance and interpreted alongside engagement time, clicks, and conversions.
Ways to Improve Scroll Experience
A strong scroll experience helps readers move through a page comfortably, find important information quickly, and stay engaged with the content.
- Strengthen the Introduction: Adopt the inverted pyramid writing style. Provide the clearest answer or most important information early in the page.
- Incorporate a Clickable Table of Contents (ToC): Allow users to skip directly to deep sections of interest rather than forcing them to scroll through long blocks of text.
- Use Helpful Visual Elements: Break up long walls of text with data callouts, short bullet points, embedded videos, or original infographics.
- Fix False Bottoms: Avoid large vertical gaps, empty areas, or sudden background changes that may make the page appear to have ended.
How Is Scroll Depth Different from Heatmaps and Scroll Maps?
Heatmaps and scroll maps are other visual analytics closely associated with scroll depth.
A heatmap is a color-coded visual report showing where users click, tap, or move their cursors, while a scroll map specifically shows what percentage of visitors reached each vertical section of the page. In other words, scroll depth provides the measurement, whereas scroll maps present that information visually and heatmaps cover a broader range of user interactions.
Tools for Measuring Scroll Behavior
Google Tag Manager (GTM) combined with Google Analytics 4 (GA4) is a common free setup for tracking scroll depth. Microsoft Clarity is a free behavioral analytics tool that provides scroll maps, heatmaps, and session recordings, while Contentsquare and Mouseflow currently offer free and paid plans with behavioral analytics and heatmap features.
Matomo can measure scroll depth through Tag Manager or custom events and also provides scroll heatmaps through its Heatmaps and Session Recording capability, with availability depending on the deployment and plan. Adobe Analytics and Mixpanel can also measure or visualize scroll-related behavior, depending on their configuration and plan.
How to Check Scroll Depth in Google Analytics 4 (GA4)
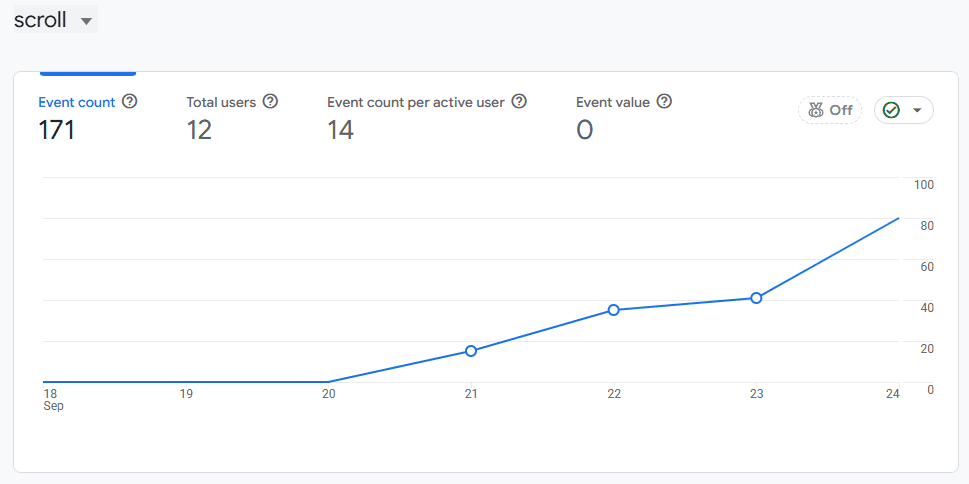
By default, GA4’s Enhanced Measurement records a scroll event once per page when 90% of the webpage’s vertical content becomes visible. Additional milestones such as 25%, 50%, and 75% require additional tracking, commonly configured through Google Tag Manager.
- Review the default scroll setting: GA4 already records a
scrollevent when a visitor reaches 90% of a page. To measure additional thresholds such as 25%, 50%, and 75%, use Google Tag Manager and a separate custom event name such asscroll_depth. - Create custom thresholds in Google Tag Manager: Add a Scroll Depth trigger and enter percentage thresholds such as 25, 50, 75, and 90. Create a GA4 event tag, use an event name such as
scroll_depth, and send the built-in Scroll Depth Threshold variable as a parameter such aspercent_scrolled. Google Tag Manager supports percentage and pixel-based scroll thresholds. - Test the implementation: Use Google Tag Manager’s Preview mode and GA4’s DebugView to confirm that each event and its parameters are being received correctly before publishing the container.
- Analyze the results: In GA4, open Explore and create a free-form exploration. Add Event name and Percent scrolled as dimensions, use Event count or Total users as metrics, and filter the report for the custom
scroll_depthevent. If a non-standard parameter is used, it must first be registered as an event-scoped custom dimension and may take 24–48 hours to become available in reports.
Frequently Asked Questions
What is a good scroll depth?
There is no universal ideal scroll depth. A useful benchmark depends on the page type, length, layout, and purpose, so performance is best compared with similar pages and historical data from the same website.
Does scroll depth directly affect SEO rankings?
Scroll depth is not a direct Google ranking factor. However, it can reveal how effectively a page keeps readers engaged and whether important content or calls to action are being reached.