
Key Takeaways
- Core Web Vitals measure loading performance, interaction responsiveness, and visual stability through LCP, INP, and CLS.
- Google evaluates Core Web Vitals using real-user field data at the 75th percentile, separately for mobile and desktop.
- Good Core Web Vitals support user experience and Search performance, but good scores do not guarantee higher rankings.
- Improvement requires identifying the affected metric, addressing its underlying cause, and retesting with field data and diagnostic tools.
A webpage can appear on the screen and still feel slow. Its main image may take several seconds to appear, a button may respond late, or text may suddenly move because an ad loads above it.
Core Web Vitals consist of three metrics used to measure real-world user experience on webpages: loading performance, responsiveness, and visual stability. They are Largest Contentful Paint (LCP), Interaction to Next Paint (INP), and Cumulative Layout Shift (CLS).
Google uses Core Web Vitals in its ranking systems and recommends good scores for both Search and user experience. However, good scores do not guarantee higher rankings, and Google says there is no single “page experience” ranking signal.
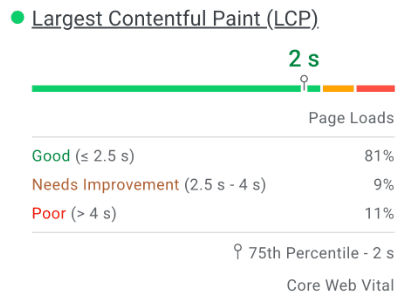
Google recommends evaluating Core Web Vitals at the 75th percentile, separately for mobile and desktop. In simple terms, a page should meet the recommended threshold for at least 75% of visits.
The example below shows how this works in practice: an LCP of 2 seconds at the 75th percentile means at least 75% of measured visits had an LCP of 2 seconds or faster.
The Three Core Web Vitals Metrics
The three Core Web Vitals each measure a different aspect of the user experience: how quickly important content appears, how responsive the page feels during interaction, and how stable the layout remains while the page is in use.
Largest Contentful Paint (LCP) — Loading Performance
What it measures: How quickly the largest image, text block, or video visible in the initial viewport is rendered.
Good score: 2.5 seconds or less.
For example, an article title may appear quickly while its large featured image takes four seconds to load. If that image is the largest visible element, it may be the LCP element.
LCP does not measure when the entire page finishes loading. It focuses on how quickly important visible content appears.
Interaction to Next Paint (INP) — Responsiveness
What it measures: How fast a page provides a visible response after user actions such as clicking, tapping, and typing.
Good score: 200 milliseconds or less.
For example, a visitor clicks an FAQ heading, but the browser is busy and the answer takes noticeable time to appear. That interaction can contribute to poor INP.
Cumulative Layout Shift (CLS) — Visual Stability
What it measures: How much visible content unexpectedly moves while someone is using a webpage.
Good score: 0.1 or less.
For example, a visitor is about to click a button when an advertisement loads above it and pushes the button downward. That unexpected movement can increase CLS.
Layout shifts occurring within 500 milliseconds of a discrete user interaction, such as a click, tap, or keypress, are generally excluded from CLS.
Other Important Web Performance Metrics
Core Web Vitals are not the only metrics used to understand webpage performance. Several supporting metrics can help identify why LCP, INP, or the overall loading experience is poor.
FID and TTI
First Input Delay (FID) was the previous Core Web Vital for responsiveness. INP replaced FID on March 12, 2024.
Time to Interactive (TTI) was an older Lighthouse metric. It was removed from Lighthouse 10 because it was overly sensitive to some network requests and long tasks.
How to Check a Site or Page’s Core Web Vitals
Different tools serve different purposes. Field-data tools show what real visitors experienced, while laboratory and diagnostic tools help identify why a page is slow or unstable. The comparison below shows where each tool fits.
- Google Search Console: The Core Web Vitals report identifies groups of URLs with Good, Need improvement, or Poor real-world performance. It is useful for site-wide monitoring.
- PageSpeed Insights: Enter an individual URL to see available real-user data together with Lighthouse lab diagnostics and improvement suggestions.
- Lighthouse: Useful for controlled testing and identifying issues involving images, JavaScript, CSS, and main-thread work.
- Chrome DevTools: Developers and technically inclined site owners can use DevTools to inspect network requests, long-running JavaScript tasks, rendering activity, and individual elements responsible for performance problems.
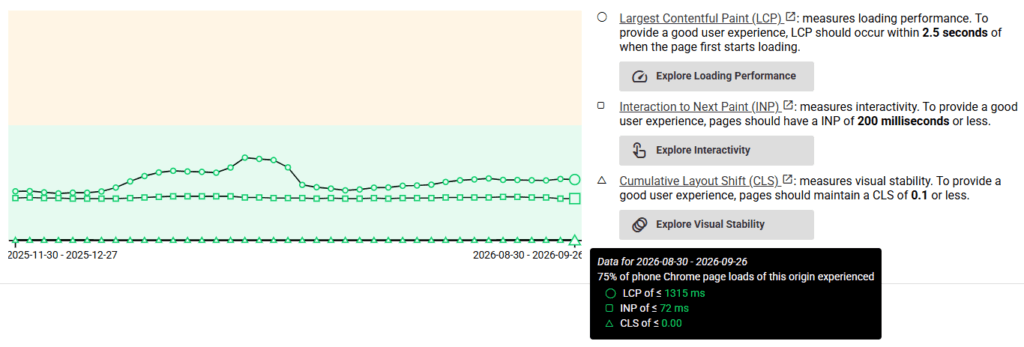
- CrUX Vis: Shows historical Chrome User Experience Report data and helps track Core Web Vitals over time. See the official CrUX Vis documentation.
A useful distinction here is field data versus lab data. Field data shows what real visitors experienced. Lab data comes from a controlled test and is mainly useful for reproducing and diagnosing problems. Google’s PageSpeed Insights documentation explains how the two types of data are used.
Lighthouse and Chrome DevTools are primarily diagnostic tools. Lighthouse runs controlled lab tests and highlights performance opportunities, while DevTools lets you investigate network requests, JavaScript execution, layout shifts, rendering activity, and individual page elements.
Lighthouse Score ≠ Core Web Vitals Pass
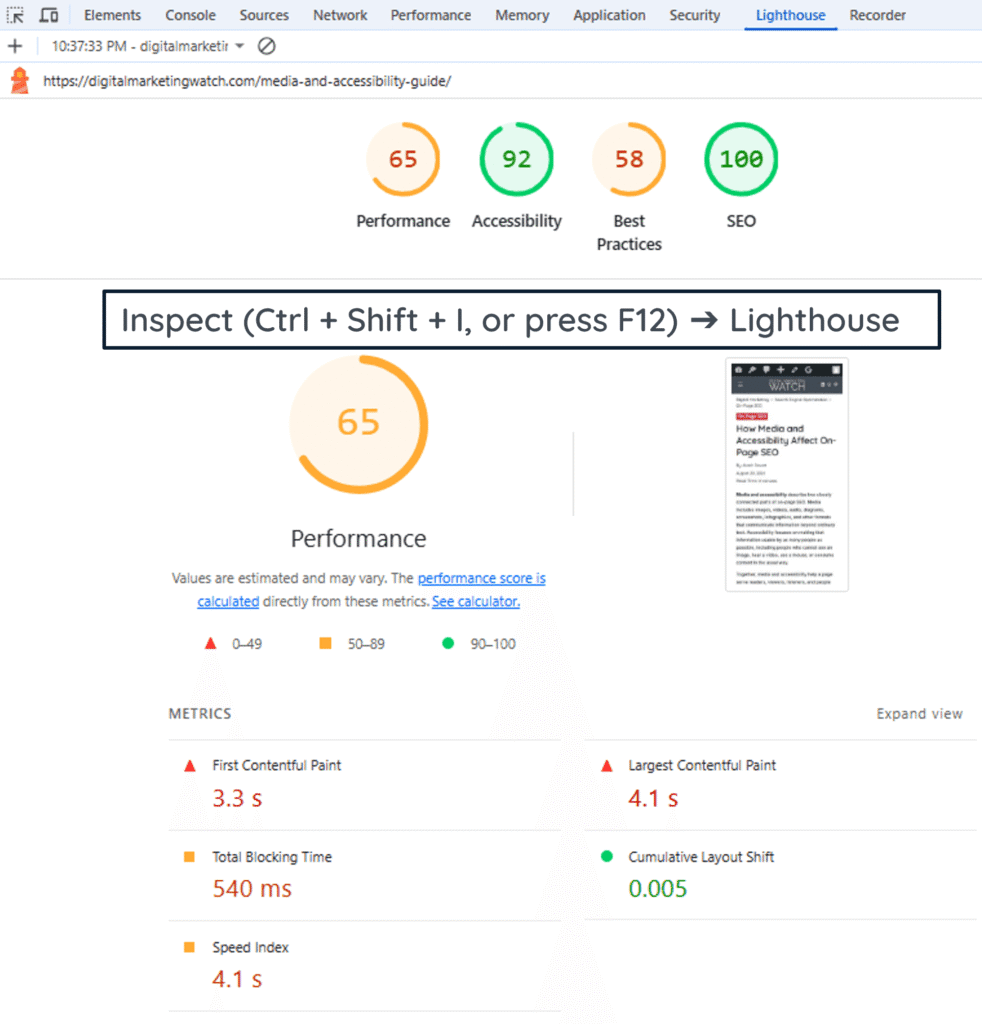
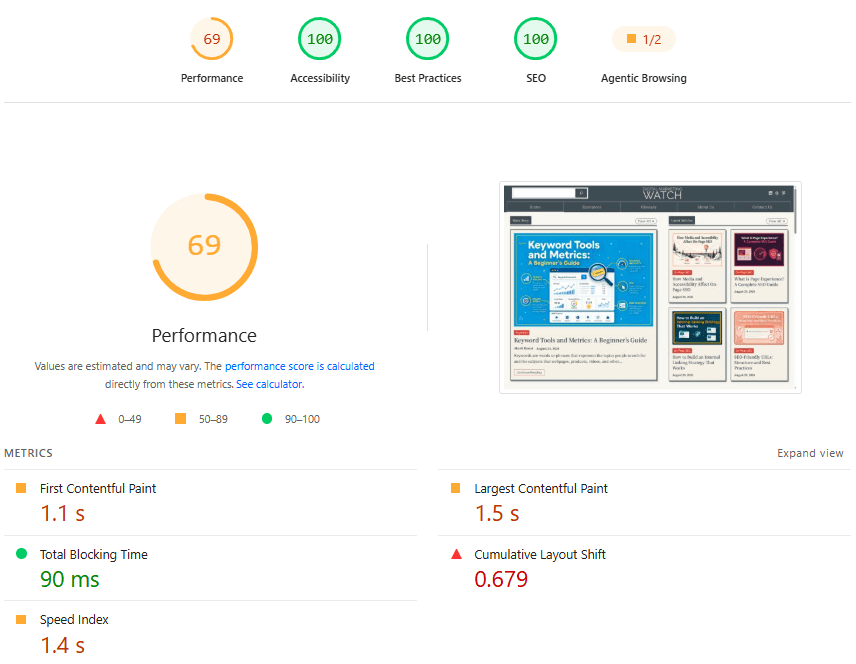
A Lighthouse Performance score is produced from a controlled lab test and is not the same as the Core Web Vitals assessment, which uses real-user field data at the 75th percentile.
What Causes Core Web Vitals Problems?
A common cause of poor responsiveness is JavaScript, the programming language websites commonly use to make pages interactive. It can open menus, validate forms, update shopping carts, run sliders, and respond to button clicks.
Browsers use a main thread for much of the work involved in running JavaScript, processing interactions, calculating layouts, and updating the screen. If a long task keeps this thread busy, another task may have to wait.
For example, if JavaScript keeps the main thread busy for 500 milliseconds and someone clicks a button during that time, the browser may not respond immediately.
Other common causes include slow server responses, oversized media, render-blocking CSS or JavaScript, third-party scripts, poorly optimized fonts, large page structures, and ads or widgets that load late and shift existing content.
How to Improve Core Web Vitals
Improving Core Web Vitals begins with identifying the affected metric and its underlying cause. A recommendation that improves LCP will not necessarily solve an INP or CLS problem.
1. How to Improve LCP
- Optimize images: Resize and compress large images and use efficient formats such as WebP or AVIF where appropriate.
- Prioritize the LCP image: Make sure the main above-the-fold image is discovered and requested early.
- Avoid lazy loading the LCP image: Lazy loading is useful lower down the page but can delay an important image already visible when the page opens.
- Reduce render-blocking resources: Remove or defer unnecessary CSS and JavaScript that delays important visible content.
- Use
fetchpriorityWhere Appropriate: Developers can usefetchpriority="high"to signal to the browser that an important LCP image deserves higher download priority. - Improve delivery: Effective caching, faster hosting, server optimization, and a CDN can reduce delays when delivery is the bottleneck.
2. How to Improve INP
- Break up long JavaScript tasks: Smaller tasks give the browser more opportunities to respond.
- Remove unnecessary JavaScript: Avoid loading scripts that the page does not need.
- Minimize Input Delay: Reduce work occupying the main thread before the browser can start responding to an interaction.
- Optimize event handlers: Code triggered by clicks, taps, or typing should perform only necessary work.
- Limit third-party scripts: Advertising, chat, analytics, social widgets, and tracking tools can add browser work.
- Avoid Excessively Large Page Structures: Very large DOM structures can increase the work required to calculate layouts and update the page.
3. How to Improve CLS
- Set image and video dimensions: Width and height information lets the browser reserve space before media loads.
- Reserve space for dynamic content: Ads, embeds, banners, and recommendation widgets should not push existing content unexpectedly.
- Avoid inserting content above existing elements: Late notices and banners can create disruptive shifts.
- Handle Web Fonts Carefully: A replacement font with substantially different dimensions can cause text and surrounding elements to shift.
- Use CSS
transformfor Animations: Where appropriate,transformcan move or resize visual elements without forcing the browser to recalculate the surrounding page layout.
Other Site-Wide Improvements
Minify or remove unused CSS and JavaScript where appropriate, use effective caching, optimize large media and video embeds, and remove plugins or apps that add substantial page weight without enough value. Upgrade hosting only when testing shows that server performance is a bottleneck.
Practical Core Web Vitals Fixes by Platform
The exact process depends on how a website is built. Some platforms already provide performance features that WordPress site owners may need to configure separately.
WordPress + Rank Math / WordPress + Yoast
WordPress already provides native image lazy loading and can prioritize a likely LCP image. With Rank Math, one may use dedicated performance tools for caching, code optimization, and image compression where needed. With Yoast, broader performance work typically involves WordPress, the theme or hosting environment, and dedicated performance tools. Rank Math PRO can also facilitate installing Imagify, which is a separate image-optimization plugin.
Wix
Wix provides built-in image optimization, CDN delivery, caching, and lazy loading. Performance optimization on Wix usually focuses on heavy above-the-fold content, unnecessary animations, videos, apps, and third-party code.
Shopify
Shopify provides CDN delivery, automatic compression and minification for CDN-served files, and built-in image-delivery features. On Shopify, performance optimization focuses on themes, apps, third-party scripts, heavy media, and the LCP image.
Frequently Asked Questions
Does a website need a good score in all three Core Web Vitals?
A website passes the Core Web Vitals assessment when all three metrics meet their recommended thresholds at the 75th percentile. Passing the assessment does not guarantee higher Google rankings.
What is the difference between field data and lab data?
Field data comes from actual visitors using different devices and connections, while lab data comes from a controlled test environment and is mainly used to diagnose performance problems.
Do Core Web Vitals apply to non-WordPress sites such as React or Next.js applications?
Yes, Core Web Vitals apply to webpages regardless of the CMS, framework, or technology used to build them.
Why are my Core Web Vitals different on mobile and desktop?
Mobile and desktop visitors can experience different hardware, network speeds, screen sizes, layouts, and content. Their performance data is therefore evaluated separately.
What if a visitor has a slow internet connection?
A slow internet connection can affect an individual visit, but field data covers many real-world visits. Core Web Vitals therefore reflect a distribution of user experiences rather than the result of a single test.